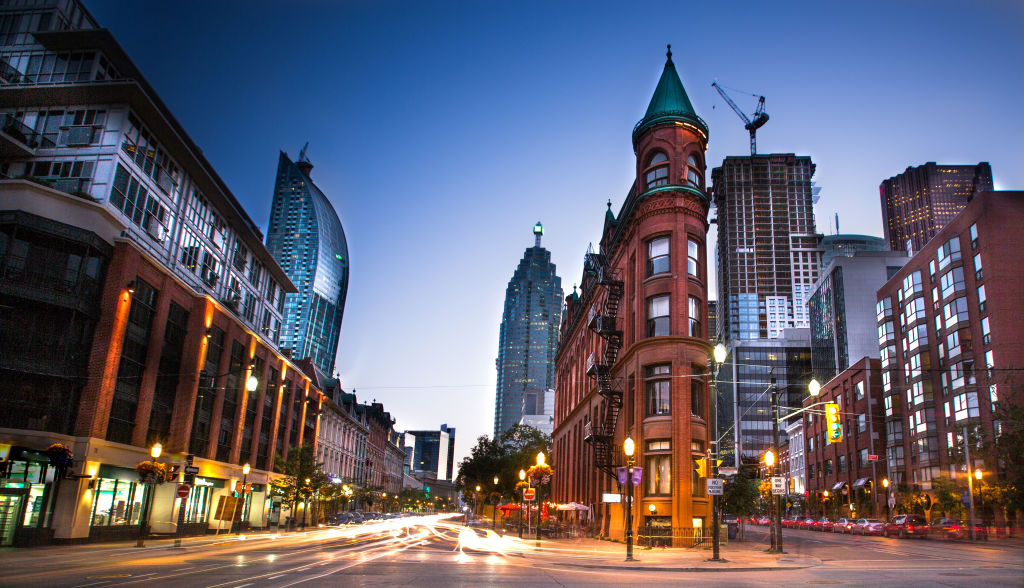
PHOTO: Auckland, NZ
Auckland is among the top cities globally for house-price growth, ranking among the likes of Los Angeles and Toronto, which all recorded price jumps of at least 30 per cent since early last year.
Property prices have boomed in three out of four top global cities during the pandemic, as changing preferences for housing, low interest rates, and increased savings drive up buyer demand and prices, according to a new report from the Chinese property portal Juwai IQI.
Montreal saw the strongest growth of the 21 cities analysed, with its median up almost 39 per cent to about $US397,360 ($540,335), with the city’s affordability noted as a key drawcard for buyers priced out of Vancouver and Toronto.

It was followed by Los Angeles (34.6 per cent), Auckland (32.2 per cent), Toronto (30 per cent) and Manchester (19.4 per cent) in the report, which tracked the price difference between the first quarter of 2020, and the latest 2021 price data – often from quarter one in many cities.
Government stimulus measures reduced the economic damage caused by the pandemic and helped inflate property markets, the report noted, at the same time, as new demand trends emerged due to buyers re-evaluating their living situation. This shift in housing preferences combined with factors such as inexpensive financing, the wealth effect, increased savings, and reduced non-housing spending had contributed to higher buyer demand.
Juwai IQI Group co-founder and executive chairman Georg Chmiel said Australian cities were near the centre of the pack compared with other major metropolises.
| Price Gain Rank | City | Before Covid ($US) | After 1+ Years of Covid ($US) | Value Gain ($US) | % Gain |
| 1 | Montreal | $ 286,099 | $ 397,360 | $ 111,261 | 38.90% |
| 2 | Los Angeles | $ 538,500 | $ 725,000 | $ 186,500 | 34.60% |
| 3 | Auckland | $ 606,267 | $ 801,388 | $ 195,121 | 32.20% |
| 4 | Toronto | $ 666,044 | $ 865,876 | $ 199,832 | 30.00% |
| 5 | Manchester | $ 283,933 | $ 339,096 | $ 55,163 | 19.40% |
| 6 | Vancouver | $ 801,634 | $ 933,875 | $ 132,241 | 16.50% |
| 7 | Shenzhen | $ 1,092,480 | $ 1,241,040 | $ 148,560 | 13.60% |
| 8 | Sydney | $ 859,779 | $ 963,050 | $ 103,271 | 12.00% |
| 9 | Perth | $ 387,900 | $ 425,630 | $ 37,729 | 9.70% |
| 10 | Lisbon | $ 206,157 | $ 224,808 | $ 18,652 | 9.00% |
| 11 | Brisbane | $ 430,165 | $ 465,637 | $ 35,472 | 8.20% |
| 12 | Berlin | $ 672,588 | $ 726,282 | $ 53,694 | 8.00% |
| 13 | Singapore | $ 1,470,432 | $ 1,581,498 | $ 111,066 | 7.60% |
| 14 | Melbourne | $ 675,542 | $ 716,771 | $ 41,228 | 6.10% |
| 15 | Kuala Lumpur | $ 397,829 | $ 421,301 | $ 23,472 | 5.90% |
| 16 | New York (Manhattan) | $ 1,075,000 | $ 1,130,000 | $ 55,000 | 5.10% |
| 17 | Paris | $ 1,477,999 | $ 1,503,433 | $ 25,434 | 1.70% |
| 18 | Ho Chi Minh City | $ 294,101 | $ 296,160 | $ 2,059 | 0.70% |
| 19 | London | $ 914,451 | $ 861,614 | -$ 52,837 | -5.80% |
| 20 | Bangkok | $ 975,549 | $ 914,090 | -$ 61,460 | -6.30% |
| 21 | Tokyo | $ 759,811 | $ 703,454 | -$ 56,356 | -7.40% |
READ MORE VIA DOMAIN


