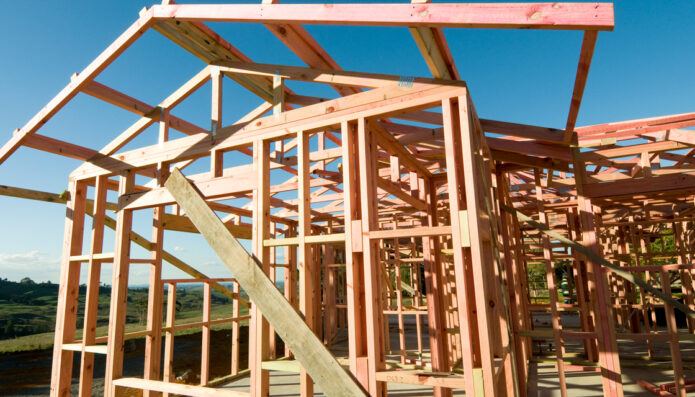
PHOTO: Barfoot & Thompson Market Report
Sales volumes by focus area
| Oct-18 | Oct-17 | 12 months to Oct-18 | 12 months to Oct-17 | |
|---|---|---|---|---|
| Central Auckland | 29 | 33 | 385 | 383 |
| Central Suburbs | 79 | 81 | 1,335 | 1,423 |
| Eastern Suburbs | 46 | 64 | 701 | 758 |
| Franklin/Manukau Rural | 62 | 46 | 904 | 695 |
| North Shore | 112 | 109 | 1,575 | 1,712 |
| Pakuranga/Howick | 83 | 72 | 802 | 798 |
| Rodney | 67 | 63 | 868 | 703 |
| South Auckland | 98 | 91 | 1,167 | 1,254 |
| West Auckland | 131 | 162 | 1,701 | 1,658 |
READ MORE VIA BARFOOT & THOMPSON


