PHOTO: CoreLogic
CoreLogic’s ‘Mapping the Market’ March 2021 update released today provides insight into how the value of property varies across cities, across the country, as well as how values have shifted over time in an interactive format.
CoreLogic Senior Property Economist, Kelvin Davidson, says “The surge in home values we’ve seen in the market over the past six to nine months would make it challenging for prospective home buyers to understand which suburbs match their budgets.
“Mapping the Market is a free visualisation tool that uses a geographic information system (GIS) – and millions of data-points in the background – to deliver an easy to interpret explanation of the current property market. By clicking on any particular NZ suburb users can instantly see its current median property value, values a year ago, and the % and $ change over that period with the aim to help enhance their property buying journey.”
Key data – Auckland
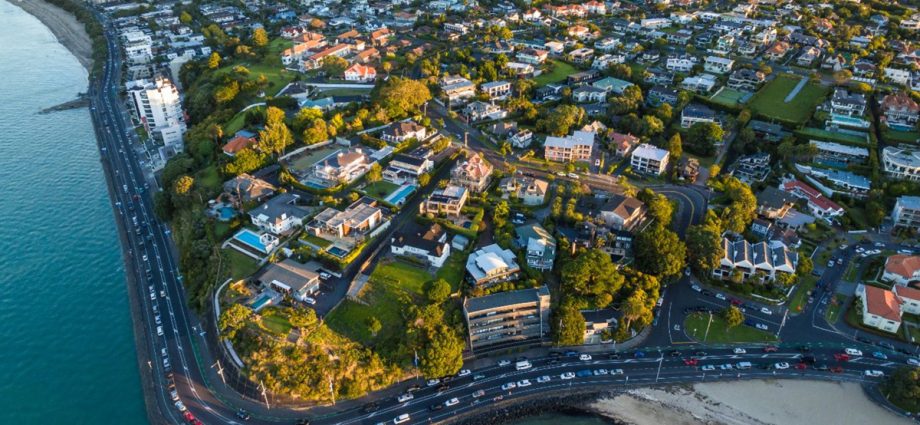
- Herne Bay remains the highest priced suburb in Auckland (and the entire country), with a median property value now of $3m. There are 12 suburbs across Auckland with a median value at least $2m, and 139 with a value at least $1m.
- All suburbs have seen median values rise over the past year, ranging from more than 20% in Otara, Manurewa East, and Red Hill, down to 1% in Auckland Central.
- When converted to dollar terms, the largest rise has been in Saint Marys Bay, at $323,350, while 144 other suburbs have seen gains of at least $100,000.
Hamilton
- Harrowfield (median property value of $937,050) is ahead of Flagstaff ($924,900) as Hamilton’s priciest suburb. Bader is the cheapest ($518,650).
- However, Bader has had the largest rise over the past year, at 17.6%. Only two Hamilton suburbs saw a rise of less than 10%. Meanwhile, in dollar terms, Queenwood, Chedworth, and Pukete have seen increases of at least $100,000.
Tauranga
- Mount Maunganui was the first suburb to crack the $1m mark, only last quarter. Its median value is now $1.11m, while Matua has also gone to $1m. Parkvale is the cheapest, at $586,900.
- However, Parkvale has topped the growth ranking (18.9%) over the past 12 months, with Matua’s gain ($132,300) the largest in dollar terms.
Wellington
- Seatoun is the priciest suburb around wider Wellington, at $1.66m. There are 26 +1m suburbs (up from 12 last quarter), and now none less than $500,000.
- Titahi Bay has had the highest growth over the past year (22.9%), with Mount Victoria at the other end of the spectrum (6.8%). In dollar terms, Karaka Bays tops the chart ($199,500), with 70 other suburbs seeing gains at least $100,000.
Christchurch
- Christchurch has five +$1m suburbs, with Scarborough on top ($1.27m). The cheapest part of the city is Phillipstown, at $331,650.
- All of Christchurch’s suburbs have seen median values rise in the past year, with Ilam on top (13.6%). Two suburbs have had at least $100,000 gains, which are Merivale and Kennedys Bush.
Dunedin
- Maori Hill is the priciest part of Dunedin ($907,700), with South Dunedin the cheapest ($400,350). Only nine suburbs are below the $500,000 mark.
- All suburbs have seen median values rise over the past year, ranging from 17.6% in North East Valley to 6.9% in Maori Hill. Vauxhall’s gain in dollar terms over the past year was $101,250, ahead of Company Bay at $91,150.
The map is colour-blocked and, as Davidson notes, “At a glance, it’s very easy to see which local suburbs sit within a particular budget and which have changed the most or least”. In addition to the visual demonstration, the smart map also provides key market commentary from the CoreLogic research team, with data highlights and trends provided for each major city. However – users can easily focus in on any part of the country they want.
To access Mapping the Market, visit www.corelogic.co.nz/mapping-
MOST POPULAR
 Grand Designs NZ: Off-grid Taylors Mistake house still not finished
 Couple reveal ‘light bulb’ moment that helped them net $1m a year in rents and retire in their 20s
 IRD to target real estate agents ‘under reporting income and overstating expenses’
 Abandoned land for sale
 TV presenter Renee Wright sells North Shore home
 Kiwis think Govt not doing enough to address housing crisis as politicians quizzed on how many homes they own
 CoreLogic NZ Monthly Property & Economic Update – March 2021 | WATCH
 Melissa Caddick’s parents and husband face being HOMELESS | AUSTRALIA
 FEATURE PROPERTY: 342 Tangiora Avenue, Whangapoua, Coromandel Peninsula | WATCH
 Northland ‘tenant from Hell’ | WATCH


