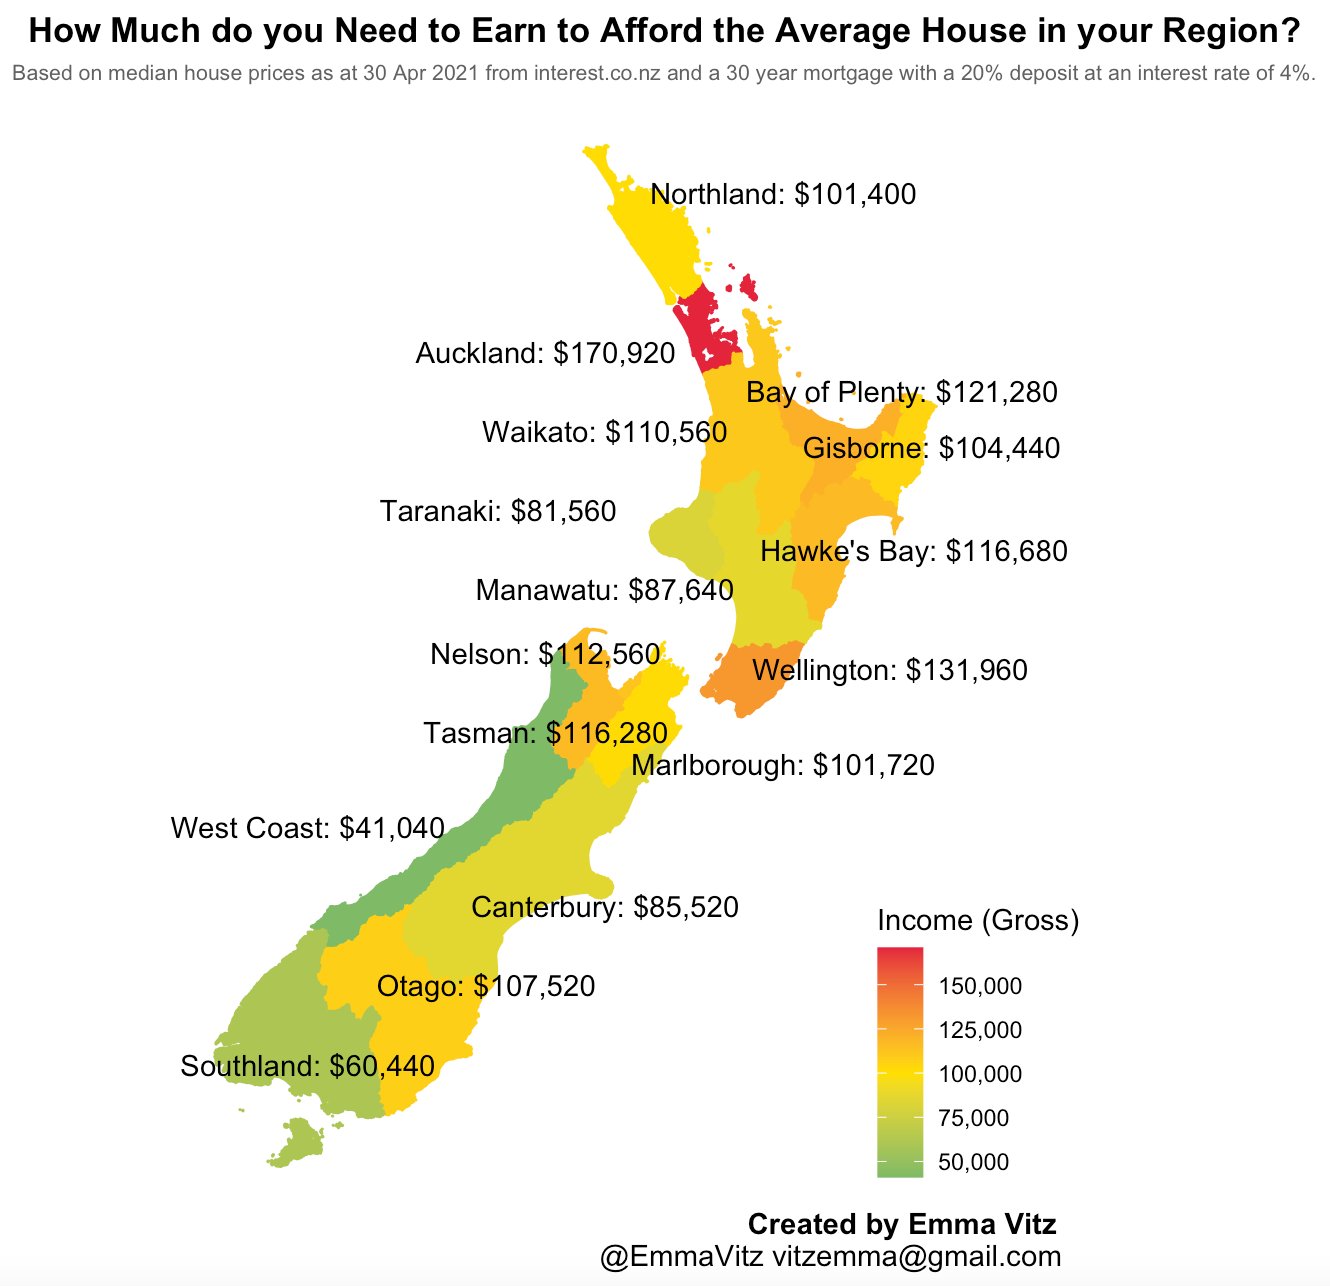
PHOTO: The graph consists of data from interest.co.nz. Photo credit: File/Emma Vitz/Twitter
A graph showing how much money people need to earn to buy the average house in their region is going bonkers on social media, with many concluding they might be in the wrong area to purchase their own home.
The graph, made by actuary trainee Emma Vitz and posted to Twitter last week, consists of data from interest.co.nz – based on a 4 percent interest rate, 20 percent deposit, 30-year mortgage, and the median house price as of April 30, 2021.
Probably missed the boat on this, but if you would like to share my maps outside of retweeting me, please use these ones which have my name on them (yes I should have put that on from the start ????) Thanks! #rstats #rspatial pic.twitter.com/zEqACEgWuo
— Emma Vitz (@EmmaVitz) June 10, 2021
It shows Aucklanders need to earn nearly $171,000 to afford the average house. In Waikato, people need to earn $110,560, Wellington $131,960, Canterbury $85,520, and Otago $107,520.
The data revealed much lower earnings were needed in two South Island regions, however – $60,440 for Southland and $41,040 on the West Coast.
But the entirety of the North Island was beyond the six-figure mark – excluding Taranaki and Manawatū, which were at $82,000 and $88,000 respectively.
Vitz said she based the figures on common financial advice that people shouldn’t be spending more than 30 percent of their income on housing.
READ MORE VIA NEWSHUB


