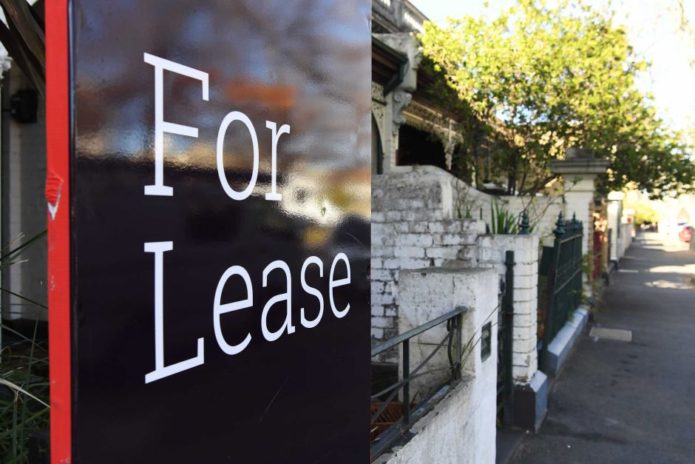
PHOTO: REINZ
Over the last decade, the Mackenzie District had the highest median price rise of all districts with median prices increasing 145.0% from $200,000 in 2010 to $490,000 in 2019 according to Real Estate Institute of New Zealand (REINZ), source of the most complete and accurate real estate data in New Zealand.
Second in New Zealand for the greatest median price growth over the last decade was the Kawerau District with median price increases of 130.4% from $115,000 in 2010 to $265,000 in 2019. This was followed by Papakura District with a 112.3% increase from $325,000 in 2010 to $690,000 in 2019.
Bindi Norwell, Chief Executive at REINZ says: “Part of Mackenzie District’s attraction is that it provides the same ‘picture-postcard views’ as the Queenstown Lakes District – particularly in the Lake Tekapo area, but it’s more affordable and doesn’t have the hustle and bustle of the constant arrival and departure of tourists.
“The area is popular with owner-occupiers, investors and holiday-home buyers alike and we’re also hearing that more and more people who have holidayed there over the years are now looking to retire there.
“In fact, one local agent we spoke to said to us ‘the secret’s out now – everyone knows what a great part of the country Mackenzie Country is!’,” continues Norwell.
“It’s been a similar situation with Kawerau, where over the last few years more people from out of town have looked to purchase in the area particularly as Rotorua and Whakatane have priced people out of those markets. Additionally, investors have looked at the area as being particularly affordable and with the lift in community spirit over the past few years, more investors have felt comfortable investing in the District.
Looking across the country, 59 of 72 districts across New Zealand saw median price increases of 50% or more over the last decade, with 5 districts increasing by more than 100%.
“We expected that the top 10 list would mostly contain areas that started from a low affordability base – as is the case for Mackenzie and Kawerau Districts, but it was interesting to see the Queenstown-Lakes District in the top 10 districts for median price growth, even though it started as the third most expensive district in 2010. Over the past 10 years, Queenstown-Lakes District saw an increase in median prices of 95.7% from $488,000 in 2010 to $955,000 in 2019, finishing up as the second most expensive district in the country behind North Shore City,” says Norwell.
Grey District was the only district across the country where the median price decreased in the past 10 years, falling by a significant -21.3% (from $235,000 in 2010 to $185,000 in 2019).
Districts with the lowest increase in median price from 2010 to 2019 were:
- Buller District: +9.5% (from $162,500 in 2010 to $178,000 in 2019)
- Wairoa District: +15.4% (from $143,000 in 2010 to $165,000 in 2019)
- Far North District: +33.3% (from $345,000 in 2010 to $460,000 in 2019).
Median house prices across New Zealand increased 67.6% over the last decade, from $352,000 in 2010 to $590,000 in 2019. New Zealand excluding Auckland saw a 62.3% increase from $308,000 in 2010 to $500,000 in 2019.
“The districts with the largest median price growth over the last decade are spread geographically around the country from Waitakere District in Auckland, down to the Queenstown-Lakes and Central Otago Districts in Otago highlighting that no one particular region has faced higher levels of unaffordability or growth,” concludes Norwell.
ENDS
Table 1: Districts with the highest percentage increase in median price 2010 v 2019
| District | Region | Median price 2010 ($) | Median price 2019 ($) | % change | |||||
| Mackenzie District | Canterbury | $200,000 | $490,000 | 145.0% | |||||
| Kawerau District | Bay of Plenty | $115,000 | $265,000 | 130.4% | |||||
| Papakura District | Auckland | $325,000 | $690,000 | 112.3% | |||||
| Waitakere City | Auckland | $382,000 | $780,000 | 104.2% | |||||
| South Waikato District | Waikato | $140,000 | $283,000 | 102.1% | |||||
| Waikato District | Waikato | $269,500 | $537,500 | 99.4% | |||||
| Central Hawke’s Bay District | Hawke’s Bay | $188,500 | $375,000 | 98.9% | |||||
| Queenstown-Lakes District | Otago | $488,000 | $955,000 | 95.7% | |||||
| Rangitikei District | Manawatu/Wanganui | $140,000 | $270,000 | 92.9% | |||||
| Central Otago District | Otago | $280,000 | $538,000 | 92.1% |
Table 2: Districts with the lowest percentage increase in median price 2010 v 2019
| District | Region | Median price 2010 ($) | Median price 2019 ($) | % change | |||||
| New Plymouth District | Taranaki | $305,000 | $440,000 | 44.3% | |||||
| Ashburton District | Canterbury | $247,500 | $352,000 | 42.2% | |||||
| Christchurch City | Canterbury | $330,000 | $460,000 | 39.4% | |||||
| Westland District | West Coast | $180,000 | $250,000 | 38.9% | |||||
| Kaikoura District | Canterbury | $292,500 | $395,000 | 35.0% | |||||
| South Taranaki District | Taranaki | $190,000 | $255,000 | 34.2% | |||||
| Far North District | Northland | $345,000 | $460,000 | 33.3% | |||||
| Wairoa District | Hawke’s Bay | $143,000 | $165,000 | 15.4% | |||||
| Buller District | West Coast | $162,500 | $178,000 | 9.5% | |||||
| Grey District | West Coast | $235,000 | $185,000 | -21.3% |


