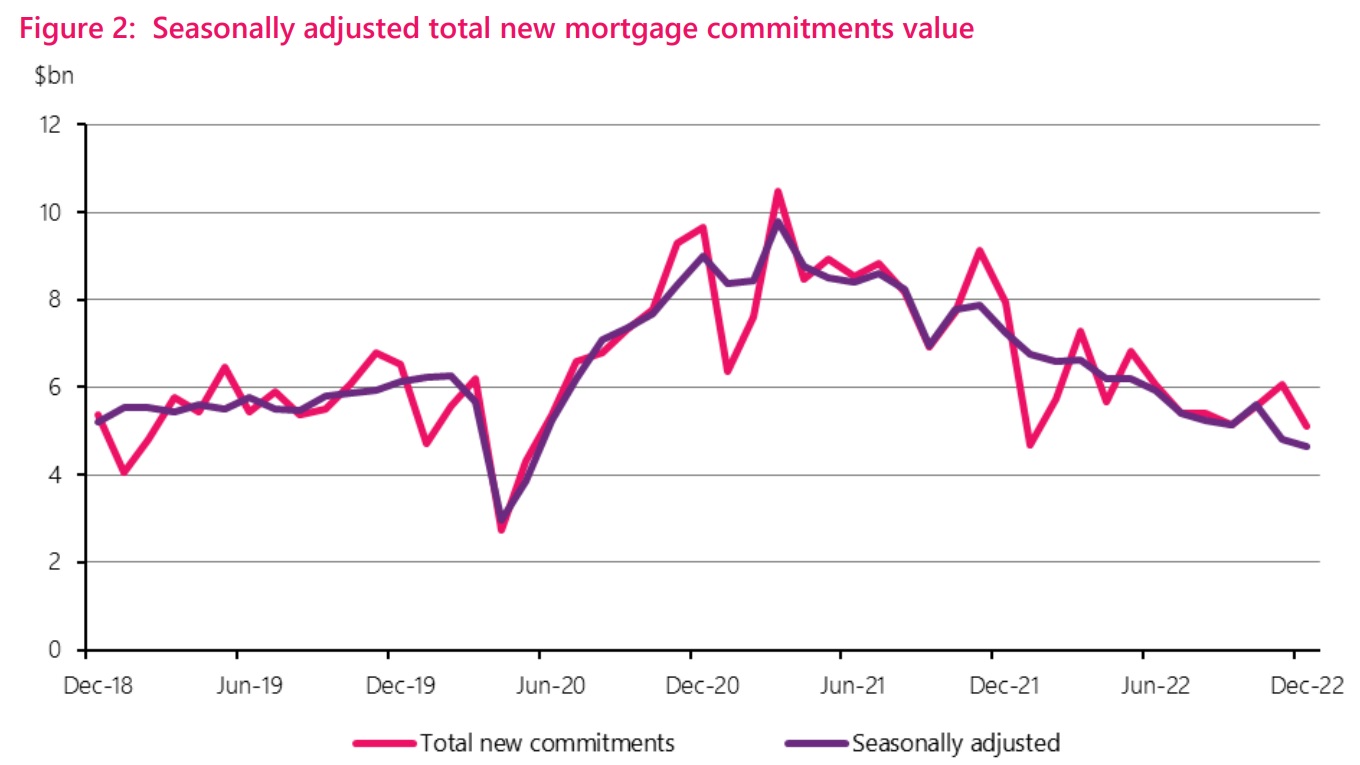
PHOTO: Mortgage lending is the the KPI (Key Performance Indicator) to predict what will happen to the property market in the coming months. FILE
This data tracks new mortgages granted to different borrower types, such as first home buyers or investors, each month.

The December 2022 total was $2.81 billion (35.4%) lower than the figure reported in December 2021 and some $4.531 billion (46.9%) lower than the mammoth $9.652 billion in December 2020 – which is the second biggest month on record, beaten only by the nearly $10.5 billion advanced in the heady days of March 2021.
| Previous years: | Monthly: | ||||||
|---|---|---|---|---|---|---|---|
| Dec 2020 | Dec 2021 | Aug 2022 | Sep 2022 | Oct 2022 | Nov 2022 | Dec 2022 | |
| Total lending ($million) | |||||||
| All borrower types | 9,652 | 7,931 | 5,413 | 5,135 | 5,582 | 6,055 | 5,121 |
| First home buyers | 1,686 | 1,562 | 1,124 | 1,064 | 1,219 | 1,357 | 1,110 |
| Other owner-occupiers | 5,452 | 4,978 | 3,320 | 3,207 | 3,379 | 3,656 | 3,020 |
| Investors | 2,436 | 1,310 | 905 | 809 | 904 | 957 | 913 |
| Business purposes | 78 | 81 | 63 | 55 | 80 | 84 | 78 |
| Higher than 80% LVR lending ($million) | |||||||
| All borrower types | 887 | 667 | 439 | 463 | 501 | 567 | 470 |
| First home buyers | 640 | 499 | 340 | 349 | 381 | 440 | 369 |
| Other owner-occupiers | 236 | 165 | 95 | 107 | 110 | 121 | 95 |
| Investors | 9 | 4 | 3 | 7 | 8 | 6 | 7 |
| Business purposes | 2 | 0 | 1 | 0 | 2 | 1 | 0 |
| Less than or equal to 80% LVR lending ($million) | |||||||
| All borrower types | 8,765 | 7,263 | 4,973 | 4,672 | 5,081 | 5,488 | 4,650 |
| First home buyers | 1,046 | 1,063 | 784 | 715 | 838 | 918 | 741 |
| Other owner-occupiers | 5,217 | 4,813 | 3,225 | 3,100 | 3,269 | 3,536 | 2,926 |
| Investors | 2,428 | 1,306 | 902 | 802 | 896 | 951 | 906 |
| Business purposes | 75 | 81 | 62 | 55 | 79 | 83 | 78 |
| MEMO ITEM: Lending to investors ($million) | |||||||
| Total lending | 2,436 | 1,310 | 905 | 809 | 904 | 957 | 913 |
| Higher than 70% LVR lending | 820 | 156 | 146 | 116 | 170 | 157 | 168 |
| Less than or equal to 70% LVR lending | 1,617 | 1,154 | 760 | 693 | 733 | 800 | 744 |
| Higher than 60% LVR lending | 1,584 | 437 | 320 | 280 | 326 | 339 | 332 |
| Less than or equal to 60% LVR lending | 852 | 873 | 585 | 529 | 578 | 618 | 580 |
SOURCE: RBNZ
MOST POPULAR
- Claims about Jacinda Ardern’s wealth
- The 10 most expensive streets in New Zealand revealed
- He sometimes struggled to pay staff, but owns a $4m holiday home
- Auckland home buyers wanting to move south as crime rises
- Grand Designs NZ penthouse for sale
- THE ANCIENT STONE CITY: Proof of NZ civilisation before Kupe
- Millennials are buying multimillion-dollar homes via TikTok as ‘property porn’ captures the next generation
- Abandoned land for sale
- Real estate industry LEGEND will be sadly missed
- Future of Grand Chateau Tongariro Hotel shrouded in mystery


