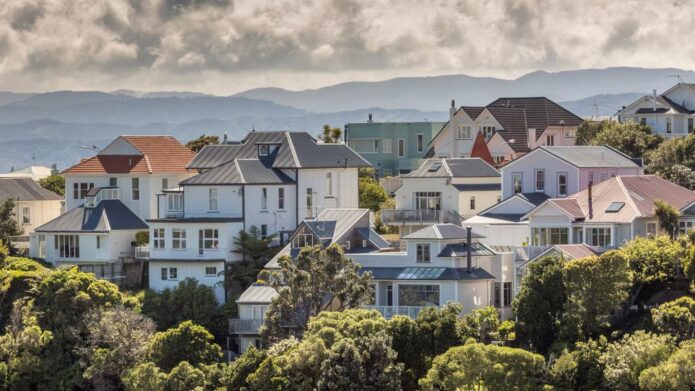
PHOTO: CoreLogic House Price Index (HPI). GETTY
The latest CoreLogic House Price Index (HPI) shows a return to the trend of gradually easing property value growth, which has been in play since April this year, but was disrupted by the bounce in values in October.
At the same time the lower North Island has seen a significant jump in listings, where there is up to 33% more properties for sale compared to the same time in 2020.
Nationally, property values were up 1.8% over November, albeit at a slower rate than October (2.1%). The annual growth rate trimmed back to 28.4% at the end of November, down from 28.8% at the end of October. This is the first time the annual rate of appreciation has dropped since August 2020 when the market stalled following the first COVID-19 forced lockdown in April and May of 2020.
CoreLogic NZ Head of Research Nick Goodall says, “This slowdown reflects the natural loss in momentum after an extended period of strong growth, which has led to a deterioration in affordability, further impacted by rising interest rates and tighter credit conditions.
“Looking ahead to 2022, this slowing momentum is likely to continue, especially with further tightening of credit. Fewer owner occupiers are able to secure high-LVR loans since 1 November, and from 1 December changes to the Credit Contract and Consumer Finance Act (CCCFA), which brings greater scrutiny of a potential borrowers’ expenses and ability to repay their loan, will further limit the amount of lending written by banks.
“Add in the continued upwards trajectory of mortgage interest rates and some banks already implementing debt-to-income limits and it’s clear that demand for residential property will be negatively impacted as we head into summer,” says Mr Goodall.
- The lift in advertised stock levels is most acute in both the wider Wellington region and the Manawatu-Whanganui region, where there are 30% and 33% respectively, more properties for sale now, than the same time in 2020.
- Both the Hawke’s Bay (+22%), and to a lesser degree Southland (+2%), regions also have more properties on the market than this time last year.
- Dunedin the only city to see an increase, from 1.6% in October to 1.9% in November.
National and Main Centres (Source: CoreLogic)
| Change in property values | Average Value | |||
| Month | Quarter | Annual | ||
| New Zealand | 1.8% | 5.4% | 28.4% | $987,401 |
| Auckland | 1.5% | 4.9% | 25.7% | $1,402,845 |
| Hamilton | 0.9% | 10.0% | 30.5% | $861,119 |
| Tauranga | 2.1% | 9.2% | 35.8% | $1,114,481 |
| Wellington | 1.0% | 4.7% | 33.5% | $1,114,979 |
| Christchurch | 3.7% | 10.0% | 35.5% | $719,493 |
| Dunedin | 1.9% | 3.6% | 21.8% | $696,009 |
MOST POPULAR
 Abandoned land for sale
 Up, up and away – RBNZ lift OCR
 First home buyers encouraged to ‘wait’ and watch interest rates | WATCH
 How KFC car park deal brought down rising real estate star | AUSTRALIA
 What it’s like to be a Billionaire in New Zealand | WATCH
 How a young woman went from being a successful real estate agent to an ice addict living on the streets
 Prime Minister Jacinda Ardern is now a property millionaire
 Residential demand surfs a wave of change to year-end
 The hiccups in the housing intensification Bill
 FACTS: 605,722 investment properties owned by 533,000 people


