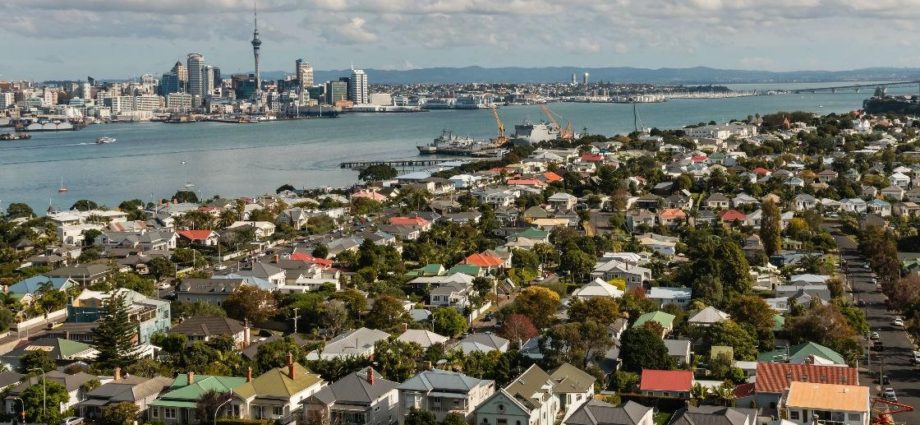
PHOTO: Auckland. FILE
The Prime Global Cities Index is a valuation-based index tracking the movement in prime residential prices in local currency across 45+ cities worldwide using data from our global research network.
Globally, prime residential prices are rising at their fastest rate since Q4 2017.
WE DON’T ROAST OUR BEANS UNTIL WE HAVE YOUR ORDER
Auckland, the index’s previous frontrunner, has seen prime prices moderate. The slowdown from 18% to 8% is in part due to the base effect – prime prices in Q1 2020 were notably higher than in Q4 2019 but also the introduction of a new capital gains tax (CGT) for non-primary residences which are bought as an investment and held for less than 10 years. Add to this President Biden’s tax proposals and we are already seeing one of the key themes in The Wealth Report 2021 – the push to curb wealth imbalances exacerbated by the pandemic – gather pace
THE KNIGHT FRANK PRIME GLOBAL CITIES INDEX Q1 2021
Ranked by annual % change1 2- M O N T H % CHANGE
(Q1 2020-Q1 2021)3 – M O N T H % CHANGE
1 Shenzhen Asia 18.9% 6.7%
2 Shanghai Asia 16.3% 8.5%
3 Guangzhou Asia 16.2% 12.6%
4 Va n c o u v e r North America 15.2% 6.3%
5 Seoul Asia 14.8% 1.3%
6 St. Petersburg Russia & CIS 13.4% 2.5%
7 Los Angeles1,3 North America 12.6% 2.2%
8 Moscow Russia & CIS 12.4% 7. 3 %
9 Taipei Asia 12.2% 6.5%
1 0 Miami1,3 North America 10.2% 2.4%
1 1 Toronto North America 10.1% 5.3%
1 2 Geneva Europe 9.2% 2.9%
1 3 Manila Asia 7. 9 % -0.4%
1 4 Stockholm Europe 7. 7 % 4.7%
1 5 San Francisco1,3 North America 7. 5 % 2.2%
1 6 A u c k l a n d Australasia 7. 5 % 5.7%
1 7 Zurich Europe 7. 2 % 2.7%
1 8 E dinburgh Europe 6.8% 2.2%
1 9 Beijing Asia 6.4% 4.3%
2 0 Perth Australasia 4.1% 0.2%
READ THE FULL REPORT HERE: Prime Global Cities Index Q1 2021
SOURCE: KNIGHT FRANK
MOST READ
 Abandoned land for sale
 NBR List: The top Kiwi wealth creators of 2021
 No fall in house prices until interest rates go up – economist
 Bill and Melinda Gates divorce after 27 years of marriage | MASSIVE Property Portfolio SPLIT
 REINZ & Tony Alexander Real Estate Survey: Wait and see for many
 Ex NRL star and real estate agent reveals himself as sportsman charged with importing methamphetamine | WATCH
 Disaster looming in Aussie housing market
 Real estate agent with a gun targets brokerage, kills 2 agents and self | NEW YORK
 Buying a house in Auckland? Hilarious TikTok sums up buyers frustrations | WATCH
 Housing crisis: No sign yet landlords are quitting housing market like they threatened


