PHOTO: REINZ
Vendors from around the country have been delivered an early Christmas present with record median prices achieved in six regions and another record median price set for the country in November, according to the latest data from the Real Estate Institute of New Zealand (REINZ), source of the most complete and accurate real estate data in New Zealand.
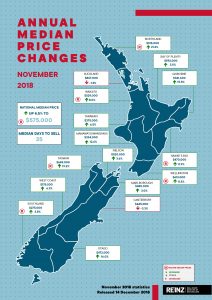
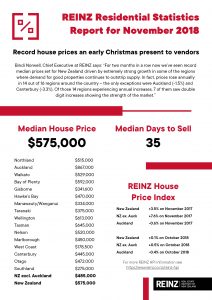
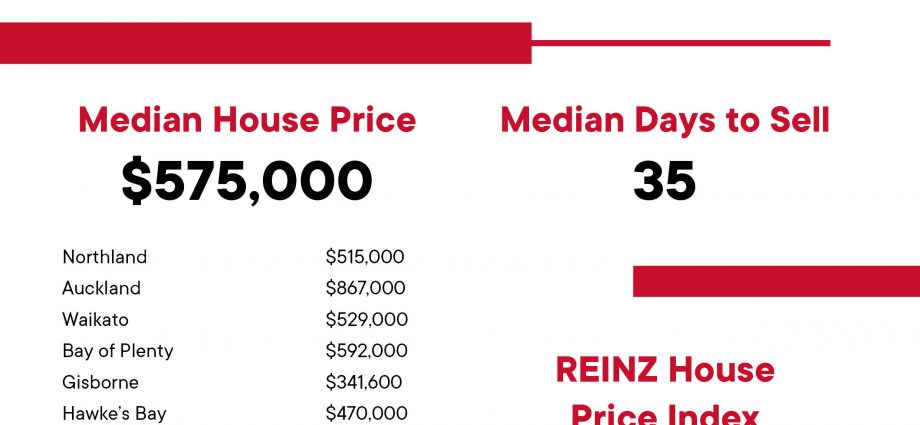
The national median house price in November for residential properties was a record $575,000 up 6.5% from $540,000 at the same time last year. For New Zealand excluding Auckland, the median house price was a record $485,000 up 7.8% from $450,000 in November 2017.
Auckland’s median house price dropped -1.5% to $867,000, down from $880,000 in November 2017, but was up from last month by 0.3%.
Additionally, six regions achieved a record price during November:
- Northland: +21.2% to $515,000 (up from $425,000 at the same time last year)
- Waikato: +8.0% to $529,000 (up from $490,000 at the same time last year)
- Hawke’s Bay: +11.9% to $470,000 (up from $420,000 at the same time last year)
- Wellington: +11.5% to $613,000 (up from $550,000 at the same time last year)
- Tasman: +19.2% to $645,000 (up from $541,000 at the same time last year)
- Southland: +3.8% to $275,000 (up from $265,000 at the same time last year).
Bindi Norwell, Chief Executive at REINZ says: “For two months in a row now we’ve seen record median prices set for New Zealand driven by extremely strong growth in some of the regions where demand for good properties continues to outstrip supply.
“In fact, prices rose annually in 14 out of 16 regions around the country – the only exceptions were Auckland (-1.5%) and Canterbury (-3.3%). Of those 14 regions experiencing annual increases, 7 of them saw double digit increases showing the strength of the market,” continues Norwell.
“While these record median prices will be a great early Christmas present for vendors selling their homes, they make hard reading for those first time buyers who are desperately saving to get onto the property market. However, with the likes of KiwiBuild and models such as BNZ’s shared-ownership scheme there is some light at the end of the tunnel for those first home buyers feeling locked out of the property market,” she continues.
“Looking at the Auckland market, there were some areas that achieved strong prices during November including Auckland City’s median price of $999,000 the highest price in 17 months, Franklin District saw the highest median price in 6 months of $700,000 and North Shore City had the highest median price in 8 months ($1,041,000). However, on the flip side, the Rodney District saw a year-on-year decrease of -11.3% and Manukau City had an annual fall of -2.2%” points out Norwell.
Good finish to spring, with volumes up 2.6% nationally
The number of houses sold across the country increased by 2.6% year-on-year to 7,286 up from 7,102 (an additional 184 houses).
For New Zealand excluding Auckland, the number of properties sold increased by 2.1% – 108 more properties when compared to November 2017 (from 5,139 to 5,247).
In Auckland, the number of properties sold increased by 3.9% or 76 more properties, from 1,963 in November 2017 to 2,039 in November 2018.
Regions with the largest annual increases in sales volumes were:
- Gisborne: +39.3% (from 61 to 85 – an additional 24 houses)
- West Coast: +28.6% (from 28 to 36 – an additional 8 houses)
- Bay of Plenty: +17.4% (from 454 to 533 – an additional 79 houses)
- Marlborough: +12.0% (from 83 to 93 – an additional 10 houses).
“November represented another strong month of property sales, with annual increases in volumes in 10 out of 16 regions, and from a national perspective, November saw the highest volume of sales across the country in six months,” says Norwell.
“There were some standout results for a couple of the regions with Gisborne’s sales the highest number of properties sold in one month for 12 years and Taranaki’s sales the highest number of properties sold in a month since March 2007 showing the buoyancy in some of these popular regions,” continues Norwell.
“However, there were some areas that had a slower end to spring with volumes down year-on-year including Nelson (-22.3%), Canterbury (-6.9%), Southland (-5.3%), Otago (-4.5%) and Wellington (-1.2%),” concludes Norwell.
REINZ House Price Index (HPI)
The REINZ House Price Index for New Zealand, which measures the changing value of property in the market, increased 3.5% year-on-year to 2,758 a new record high for the country.
The HPI for New Zealand excluding Auckland increased 7.6% from November 2017 to a new record high of 2,663. The Auckland HPI decreased -0.6% year-on-year to 2,873.
The REINZ HPI again saw 11 out of 12 regions experience an increase over the past 12 months, highlighting the continued strength of the property market. The only exception was Auckland.
In November the Manawatu/Wanganui region again had the highest annual growth rate, a 16.4% increase to a new record high of 2,853, followed by Gisborne/Hawke’s Bay in second place with an annual growth rate of 12.4% to a new record high of 2,633 and in third place was Otago with an 11.6% annual increase to a new record high of 2,823.
Interestingly, Waikato’s index level of 2,879 (a 6.7% increase since November last year) has now overtaken Auckland’s index level of 2,873 – the first time Auckland’s index level has been overtaken since March 2015.
Days to Sell
The median number of days to sell a property nationally increased by 2 days from 33 to 35 when compared to November last year.
For New Zealand excluding Auckland, the median days to sell increased on an annual basis by 2 days from 32 to 34.
Auckland saw the median number of days to sell a property increase by 2 days to 37 days (up from 35 in November 2017). This is the lowest median days to sell since December 2017.
For the fifth month in a row, Southland has the lowest days to sell of all regions at 23 days, down from 29 at the same time last year.
Auctions
Auctions were used in 15.3% of all sales across the country in November, with 1,112 properties selling under the hammer – this is down from the same time last year, when 17.4% of properties (1,235) were sold via auction.
For the tenth month in a row, Gisborne had the highest percentage of auctions across the country with 50.6% (or 43 properties) in the region sold under the hammer – up from 37.7% (23 properties) in November 2017.
Auckland saw the second largest percentage of auctions on 25.7% (524 properties) down from 33.3% in November 2017 (653 properties). The Bay of Plenty maintained its spot of having the third highest level of auctions in the country with 20.1% (111 properties) sold under the hammer, down from 23.1% (105 properties) for the same period last year.
Inventory
The number of properties available for sale nationally decreased by -0.5% from 27,488 to 27,361 – a decrease of 127 properties compared to 12 months ago. This is the first decrease in inventory in 3 months.
November again saw 7 regions with an annual increase in inventory levels. Regions with the largest increase were:
- Marlborough: +12.2% from 327 to 367 – an additional 40 properties
- Nelson: +8.5% from 413 to 448 – an additional 35 properties
- Northland: +8.1% from 1,337 to 1,445 – an additional 108 properties.
Regions with the biggest falls in inventory were:
- Gisborne: -28.2% from 163 to 117 – 46 fewer properties
- Otago: -24.5% from 756 to 571 – 185 fewer properties
- Manawatu/Wanganui: -21.4% from 1,137 to 894 – 243 fewer properties.
Wellington again has the lowest level of inventory with 7 weeks’ inventory, followed by Otago and Gisborne on 8 weeks’ inventory available to prospective purchasers.
Price Bands
The number of homes sold for less than $500,000 across New Zealand fell from 44.5% of the market (3,157 properties) in November 2017 to 39.6% of the market (2,883 properties) in November 2018. This is the first time the percentage of properties sold for less than $500,000 has fallen below the 40% mark.
The number of properties sold in the $500,000 to $750,000 bracket increased from 27.6% in November 2017 (1,957 properties) to 30.2% in November 2018 (2,201 properties).
At the top end of the market, properties sold for more than $1 million decreased marginally from 14.9% in November 2017 (1,061 houses) to 14.7% in November 2018 (1,072 houses).
ENDS
REINZ MEDIA RELEASE PROVIDED TO Property Noise Group


