


PHOTO: Jen Baird, Chief Executive at REINZ
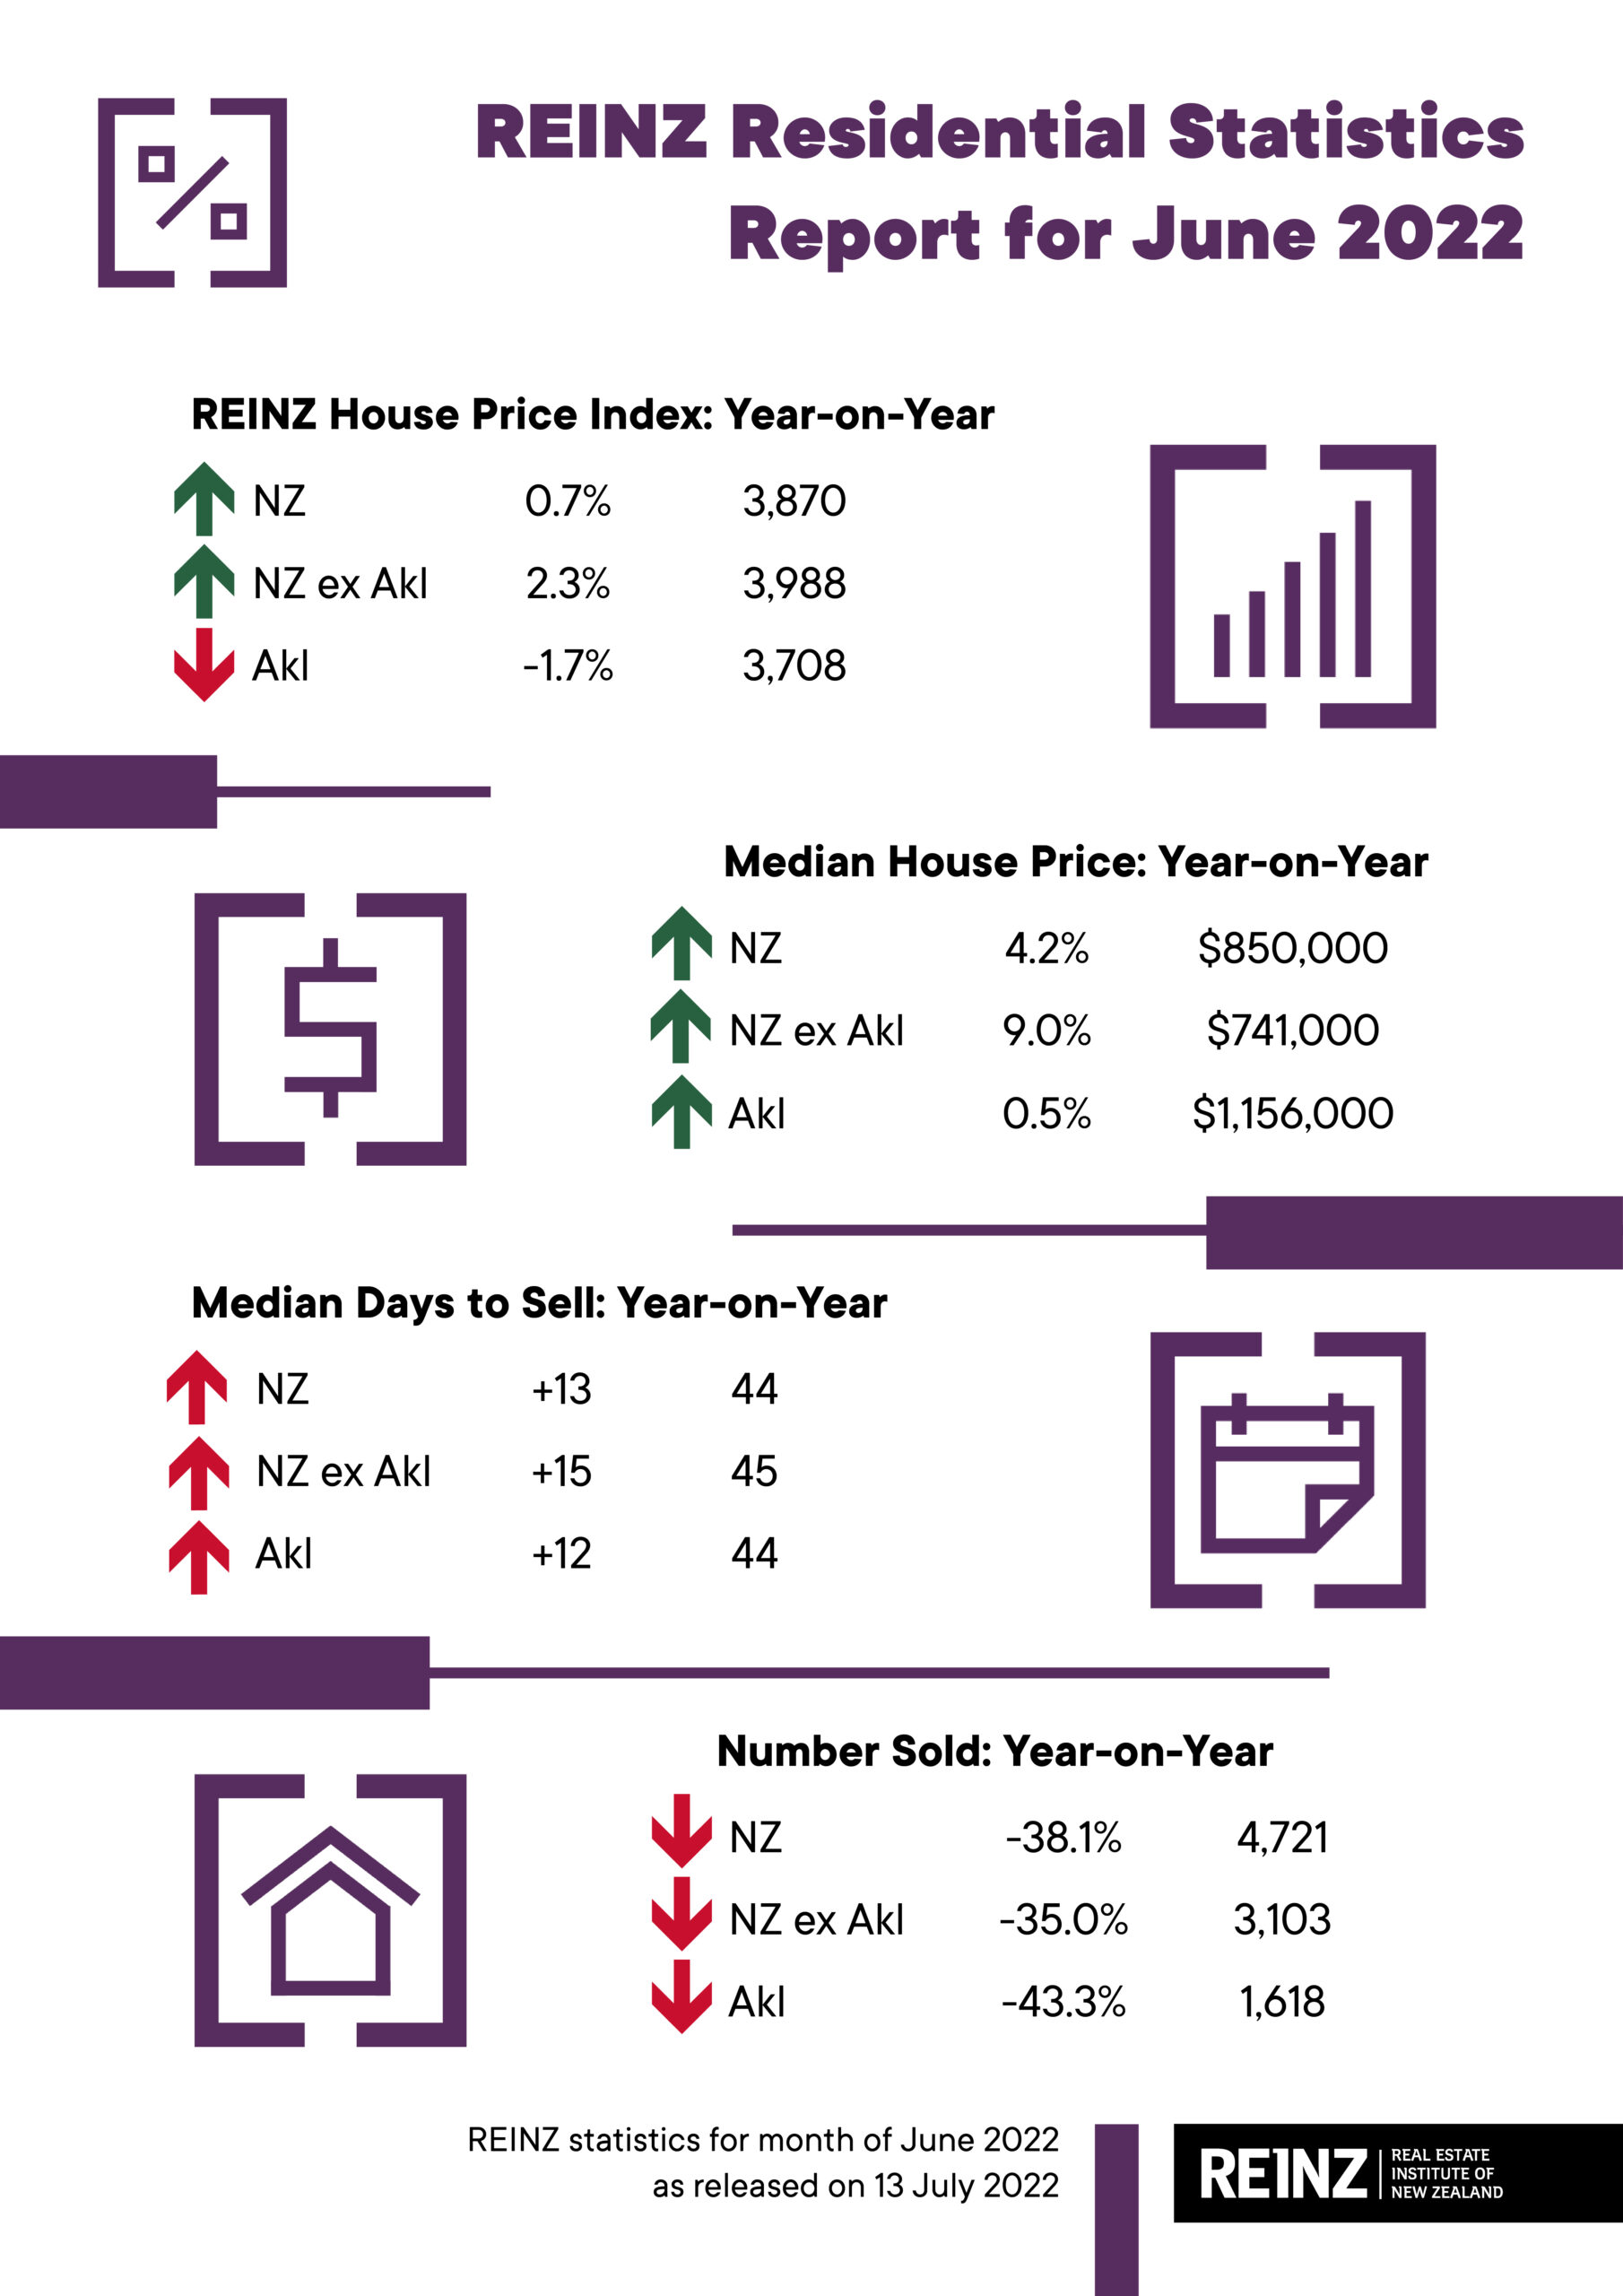
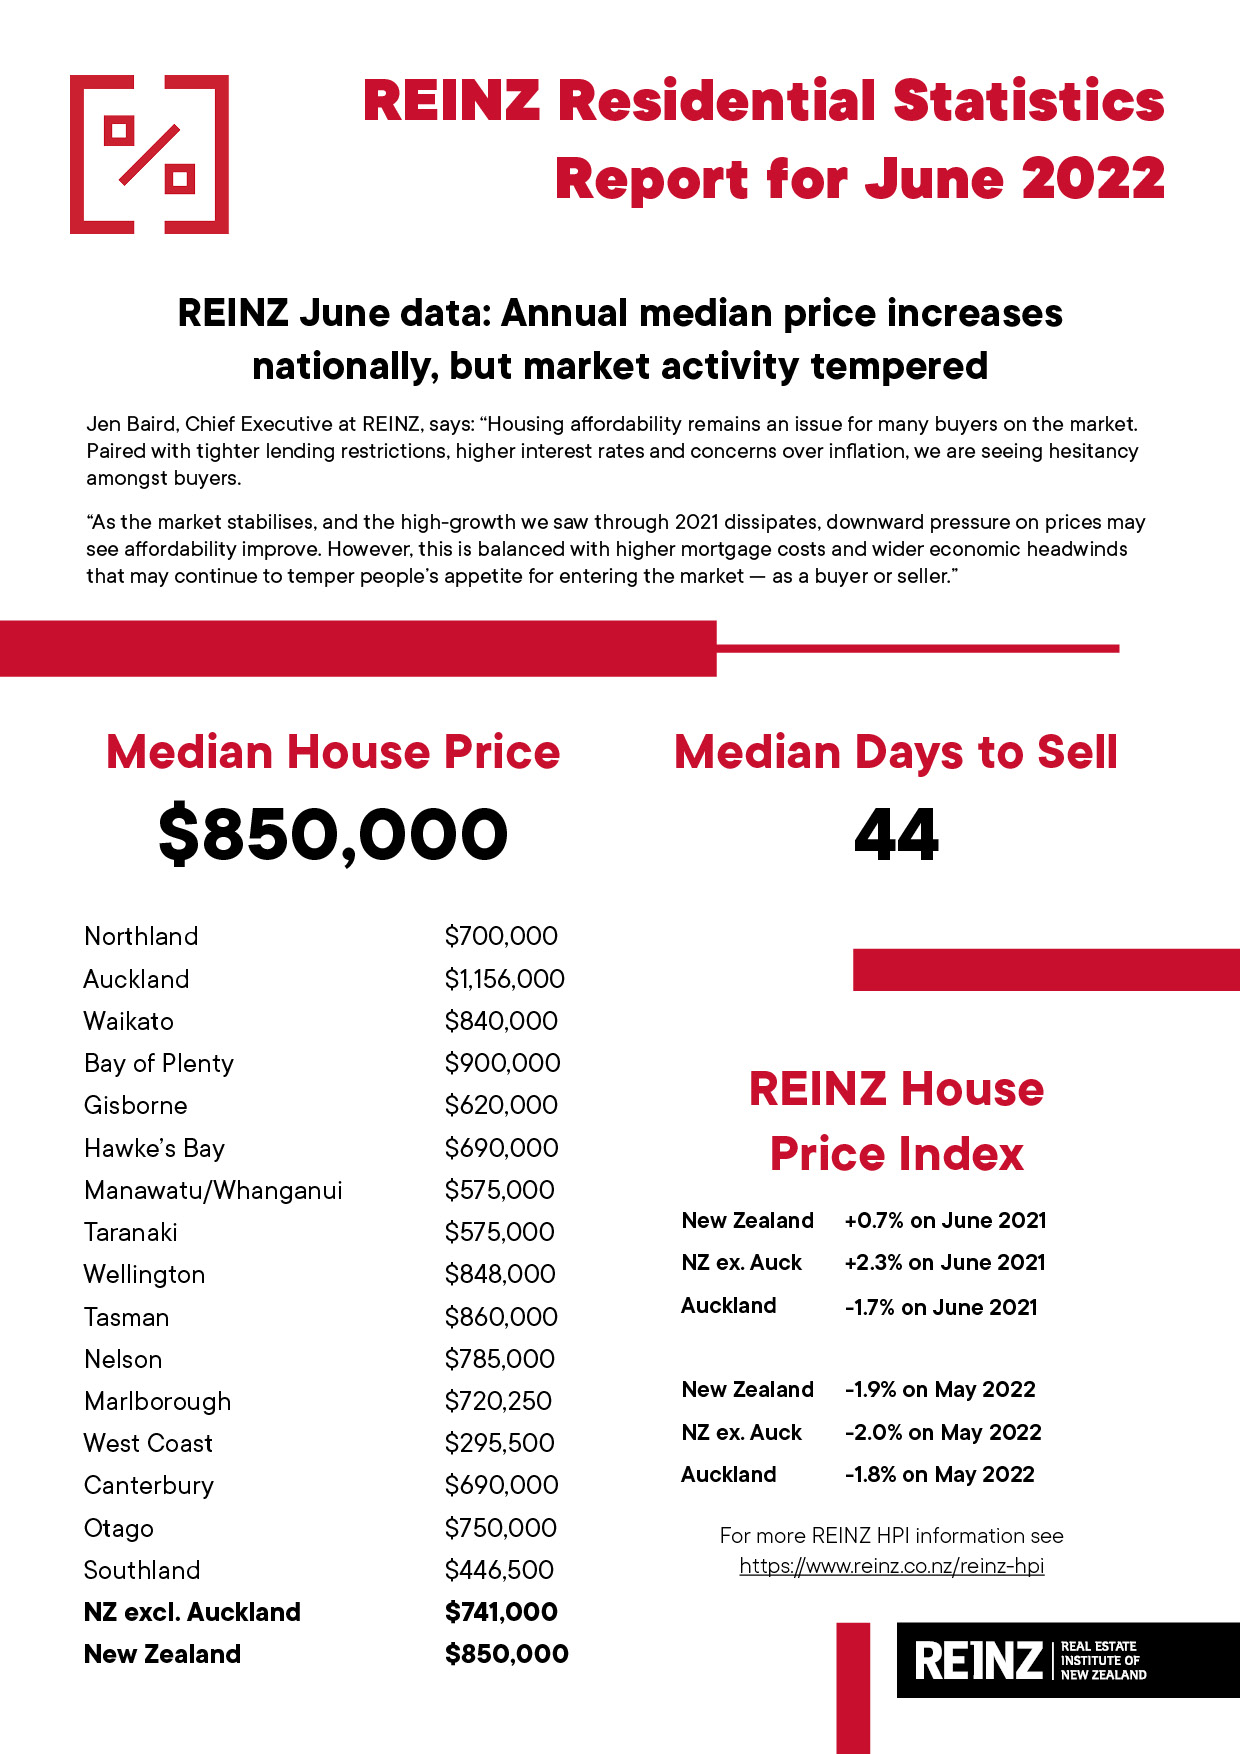
The New Zealand median price increased 4.2% annually in June, from $816,000 in June 2021 to $850,000 in June 2022. However, dampened demand sees sales activity down and days to sell are up, according to the latest data and insights from the Real Estate Institute of New Zealand (REINZ), home of the most complete, accurate and up-to-date real estate data in New Zealand.

The median residential property price for New Zealand excluding Auckland increased 9.0% annually from $680,000 in June 2021 to $741,000 in June 2022. There was a month-on-month increase of 1.1% from $733,000.
Following negative annual movement in May, the median price in Auckland increased 0.5% compared to June last year from $1,150,000 to $1,156,000 in June 2022. Auckland also recorded a month-on-month increase of 2.8% — up from $1,125,000 in May. Though Auckland City and Waitakere City recorded negative annual median price movements, the smaller territorial authorities (TAs) of Rodney, Papakura and Franklin had double digit increases in median price.
Canterbury was the region with the strongest annual percentage growth in June. The median price in the region increased 22.1% annually — from $565,000 to $690,000 in June 2022. The Waikato region had an annual increase of 14.3% — from $735,000 to $840,000.
Four regions showed an annual decrease in median price. Wellington was down 4.2% from $885,000 in June 2021 to $848,000 in June 2022. There was less volatility in median prices across TAs in the region, indicating more consistent market dynamics. Six of the eight TAs in the Wellington region had negative median price movement, with one showing no movement and only South Wairarapa increasing.
Hawke’s Bay was down 1.4% from $700,000 to $690,000, the median price in Manawatu/Whanganui decreased 1.1% from $581,200 to $575,000, and Taranaki saw a marginal decrease of 0.2% from $576,000 to $575,000 over the same period.
Six territorial authorities (TAs) achieved record medians. Three of those were in Waikato, two in Canterbury and one in the West Coast. More information on activity by region and TA record median prices can be found in the regional commentaries in the REINZ Monthly Property Report.
Jen Baird, Chief Executive at REINZ, comments: “The median price across New Zealand increased 4.2% annually, to $850,000 in June 2022. Month-on-month, there was a 1.2% increase in median price. As we moved from May into June, the seasonally adjusted figures show an increase of 1.5%, indicating performance was marginally better than expected.
“We’re seeing volatility across the country as the market seeks equilibrium at a more moderate pace. While Canterbury saw its median price increase 22.1%, and Waikato was up 14.3%, four regions dipped into negative annual price movements. Wellington was down 4.2% compared to June last year.
“Housing affordability remains an issue for many buyers on the market. Paired with tighter lending restrictions, higher interest rates and concerns over inflation, we are seeing hesitancy amongst buyers.
“As the market stabilises, and the high-growth we saw through 2021 dissipates, downward pressure on prices may improve affordability. However, this is balanced with higher mortgage costs and wider economic headwinds that may continue to temper people’s appetite for entering the market — as a buyer or seller.
“Further changes to the Credit Contracts and Consumer Finance Act (CCCFA) regulations have been implemented, which may alleviate some pressure on borrowers. However, it’s yet to be seen whether the recent changes go far enough to remedy the handbrake on activity they initiated when introduced in December 2021,” Baird observes.

Sales increase month-on-month
Across New Zealand, the number of residential property sales decreased annually by 38.1% in June 2022, from 7,629 in June 2021 to 4,721.
The sales count for New Zealand excluding Auckland decreased 35.0% annually from 4,776 to 3,103.
All regions saw an annual decrease in the number of sales, only West Coast (+31.0%) had a month-on-month increase.
Those with the greatest annual percentage decrease were:
- Auckland, which decreased 43.3% annually from 2,853 to 1,618
- Bay of Plenty, which decreased 41.3% annually from 458 to 269
- Gisborne, which decreased 39.5% annually from 43 to 26
- Taranaki, which decreased 39.4% annually from 198 to 120.
“We expect activity to decrease over the winter months as part of the usual annual property market cycle. In June, residential property sales decreased annually by 38.1%. Month-on-month, sales decreased 17.3%. However, the seasonally adjusted figures moving from May to June show a 5.8% decrease — so while sales activity was still below what is expected, the drop isn’t as stark.
“With more stock on the market, more opportunity for negotiation, and prices off their peak, for those with access to finance, there is opportunity here. Reports from real estate professionals across New Zealand suggest owner occupiers remain strong in the market. First home buyers are remerging — confidence boosted given current dynamics and the Government’s May Budget announcement, which increased the cap on the price of property eligible for a First Home Grant and the removal of caps for First Home Loans. Investors remain quiet, for now.
“There is much more negotiation happening in the market today as buyers are more cautious of potential price declines after they have purchased, and vendors understandably want the best prices possible in an uncertain market.
“For vendors motivated to sell, they should seriously consider advice from their real estate professionals who are operating at the coal face and understand market sentiment. This may involve presenting a property in a particular way or adjusting price expectations so as to give the real estate professional the ability to conduct negotiations with vendors that lead to a sale for the best possible price,” Baird comments.
Housing market value increases 0.7% nationally
The REINZ House Price Index (HPI) for New Zealand, which measures the changing value of residential property nationwide, showed an annual increase of 0.7% from 3,843 in June 2021 to 3,870 — down 9.5% from its peak in November 2021.
For New Zealand excluding Auckland, the HPI increased 2.3% annually — from 3,899 in June 2021 to 3,988 in June 2022. Auckland saw an annual decrease on the house price index of 1.7% — from 3,772 to 3,708.
Canterbury and Northland ranked top of the HPI for annual value movements. Canterbury has been in the top two in terms of HPI movement for nine months — ranking first for the last eight. In June, Canterbury recorded an annual increase of 15.2%. Northland has ranked second for six months, with an annual increase of 9.0% in June 2022, and Taranaki had an annual increase of 8.1%.
Including Auckland, four of the 12 regions had a negative annual HPI movement. Wellington saw a further decrease on the index, down 12.2% compared to June last year — from 4,134 to 3,631. Wellington has now ranked bottom two of all regions on the HPI for eight consecutive months.
Manawatu/Whanganui had the second-lowest result, down 3.0% compared to June 2021 — from 5,042 to 4,890, and Gisborne/Hawke’s Bay was down 1.3% on the HPI — from 4,277 to 4,222.
All regions have had decreases in HPI movements over the past three months. Canterbury, Taranaki and Southland have seen the best results, down 2.5% over the three months ended June 2022.

Median days to sell increases
Across New Zealand, the median number of days to sell (DTS) a property in June was 44 — up 13 compared to June 2021. For New Zealand excluding Auckland, it increased 15 days to 45.
Two regions saw annual decreases in the median DTS; West Coast was down five days to 28 and Gisborne was down three days to 38 — the region’s lowest days to sell since January 2022.
At 66, Hawke’s Bay had the highest median DTS of all regions and the highest in the region since January 2009. Otago’s median DTS in June was 52, the region’s highest since May 2013, and Manawatu/Whanganui at 54 had its highest median DTS since July 2015.
Stock stays on market — listings edge up
Nationally, the total number of properties available for sale increased 89.5% annually, from 13,861 in June 2021 to 26,271. For New Zealand excluding Auckland, inventory increased 107.8%, from 7,612 to 15,820.
Excluding the West Coast (+19.6%), all regions saw inventory levels increase annually by 40% or more. Seven regions saw inventory more than double compared to the same period last year.
Wellington and Manawatu/Whanganui have had over twice the inventory they recorded in the same month the year prior for seven consecutive months — up 179.1% and 131.8%, respectively, in June 2022 compared to June 2021. In addition, Nelson increased 186.7%, Bay of Plenty was up 158.9%, Waikato saw inventory rise by 130.3%, and Otago by 101.8% compared to June 2021.
Listings were up 1.6% across New Zealand in June, and 6.5% for New Zealand excluding Auckland. Nelson and Waikato had over 20% more listings than one year prior, at 41.8% and 20.7%, respectively. Listings were down in Southland (-13.1%) for the sixth consecutive month, and Gisborne for the fifth consecutive month (-6.3%).
“The figures indicate stock is staying on the market for longer. In June, inventory levels increased 89.5% and the median days to sell across New Zealand is now 44. Meanwhile listings were up a more marginal 1.6%.
“More stock on the market, means more choice for buyers. With stock growth in some regions in triple figures, the urgency we saw through 2021 has eased and buyers feel they have more time to find the right property, undertake their due diligence and make an informed life decision.
“However, there are multiple factors at play, including a lengthier sales process as we continue to see more sales conditional upon finance or sale of a home. Further, access to finance and concerns around inflation and rising interest rates cause hesitancy amongst would-be buyers and sellers,” Baird adds.
Inventory and listings data come from realestate.co.nz.

Sales by auction remain tempered
Across New Zealand, 565 properties sold by auction in June representing 12.0% of overall sales compared to 26.3% in June 2021. In May, 10.9% of properties were sold by auction.
For New Zealand excluding Auckland, 9.1% (282) of properties were sold by auction in June 2022 compared to 17.5% in June 2021.
The Canterbury region had the highest percentage of sales by auction at 23.4% (171), down from 28.0% in June last year. Gisborne saw 19.2% of properties sell at auction compared to 32.6% in June 2021 — for a June month, this was the lowest in Gisborne since June 2015. In Auckland, the percentage of sales by auction was 17.5%, compared to 41.0% last year.
In the Bay of Plenty Region, 7.8% of properties sold at auction (21) in June 2022, compared to 36.0% in June last year. This was the lowest percentage of sales by auction in the region since January 2013 (excluding April 2020). In Northland, 9.9% of properties sold at auction (13) compared to 27.0% the June prior — the region’s lowest since January 2021.

“Auctions attract serious buyers and while you need to be able to buy unconditionally to be successful under the hammer, serious buyers who can only buy conditionally are now being successful in the days post-auction. Over 2021, the market was highly competitive, and auctions increasingly became the preferred method of sale, underpinned by a high clearance rate. As the market has slowed and the pool of buyers able to buy unconditionally has decreased — with more contracts subject to finance or other conditions — homeowners are considering alternatives,” concludes Baird.
MOST POPULAR
 20-year-old buys first home after ditching waitress job for OnlyFans
 Real estate brand @realty brings 100% commission with no fees to NZ | WATCH
 Mortgage rates aren’t going to get as high as expected
 Property investor charged with fraudulently obtaining millions of dollars in home loans
 Real estate agent shares two radiant last pictures of his wife who tragically died
 Developer seeks to turn $12.5m heritage farm into luxury golf course | WATCH
 40 homes closer to being lost after busway decision
 Abandoned land for sale
 REDEMPTION: The Block NZ | 2022 is almost here
 Propellor Property Investments | Statement – Nikki Connors