PHOTO: Image by rawpixel.com
Highlights
- November data shows median prices continue to ease across the country
- Rising interest rates, access to finance and concerns around the economy contributed to continued hesitancy in the market
- Residential property sales across New Zealand decreased annually by 36.1%
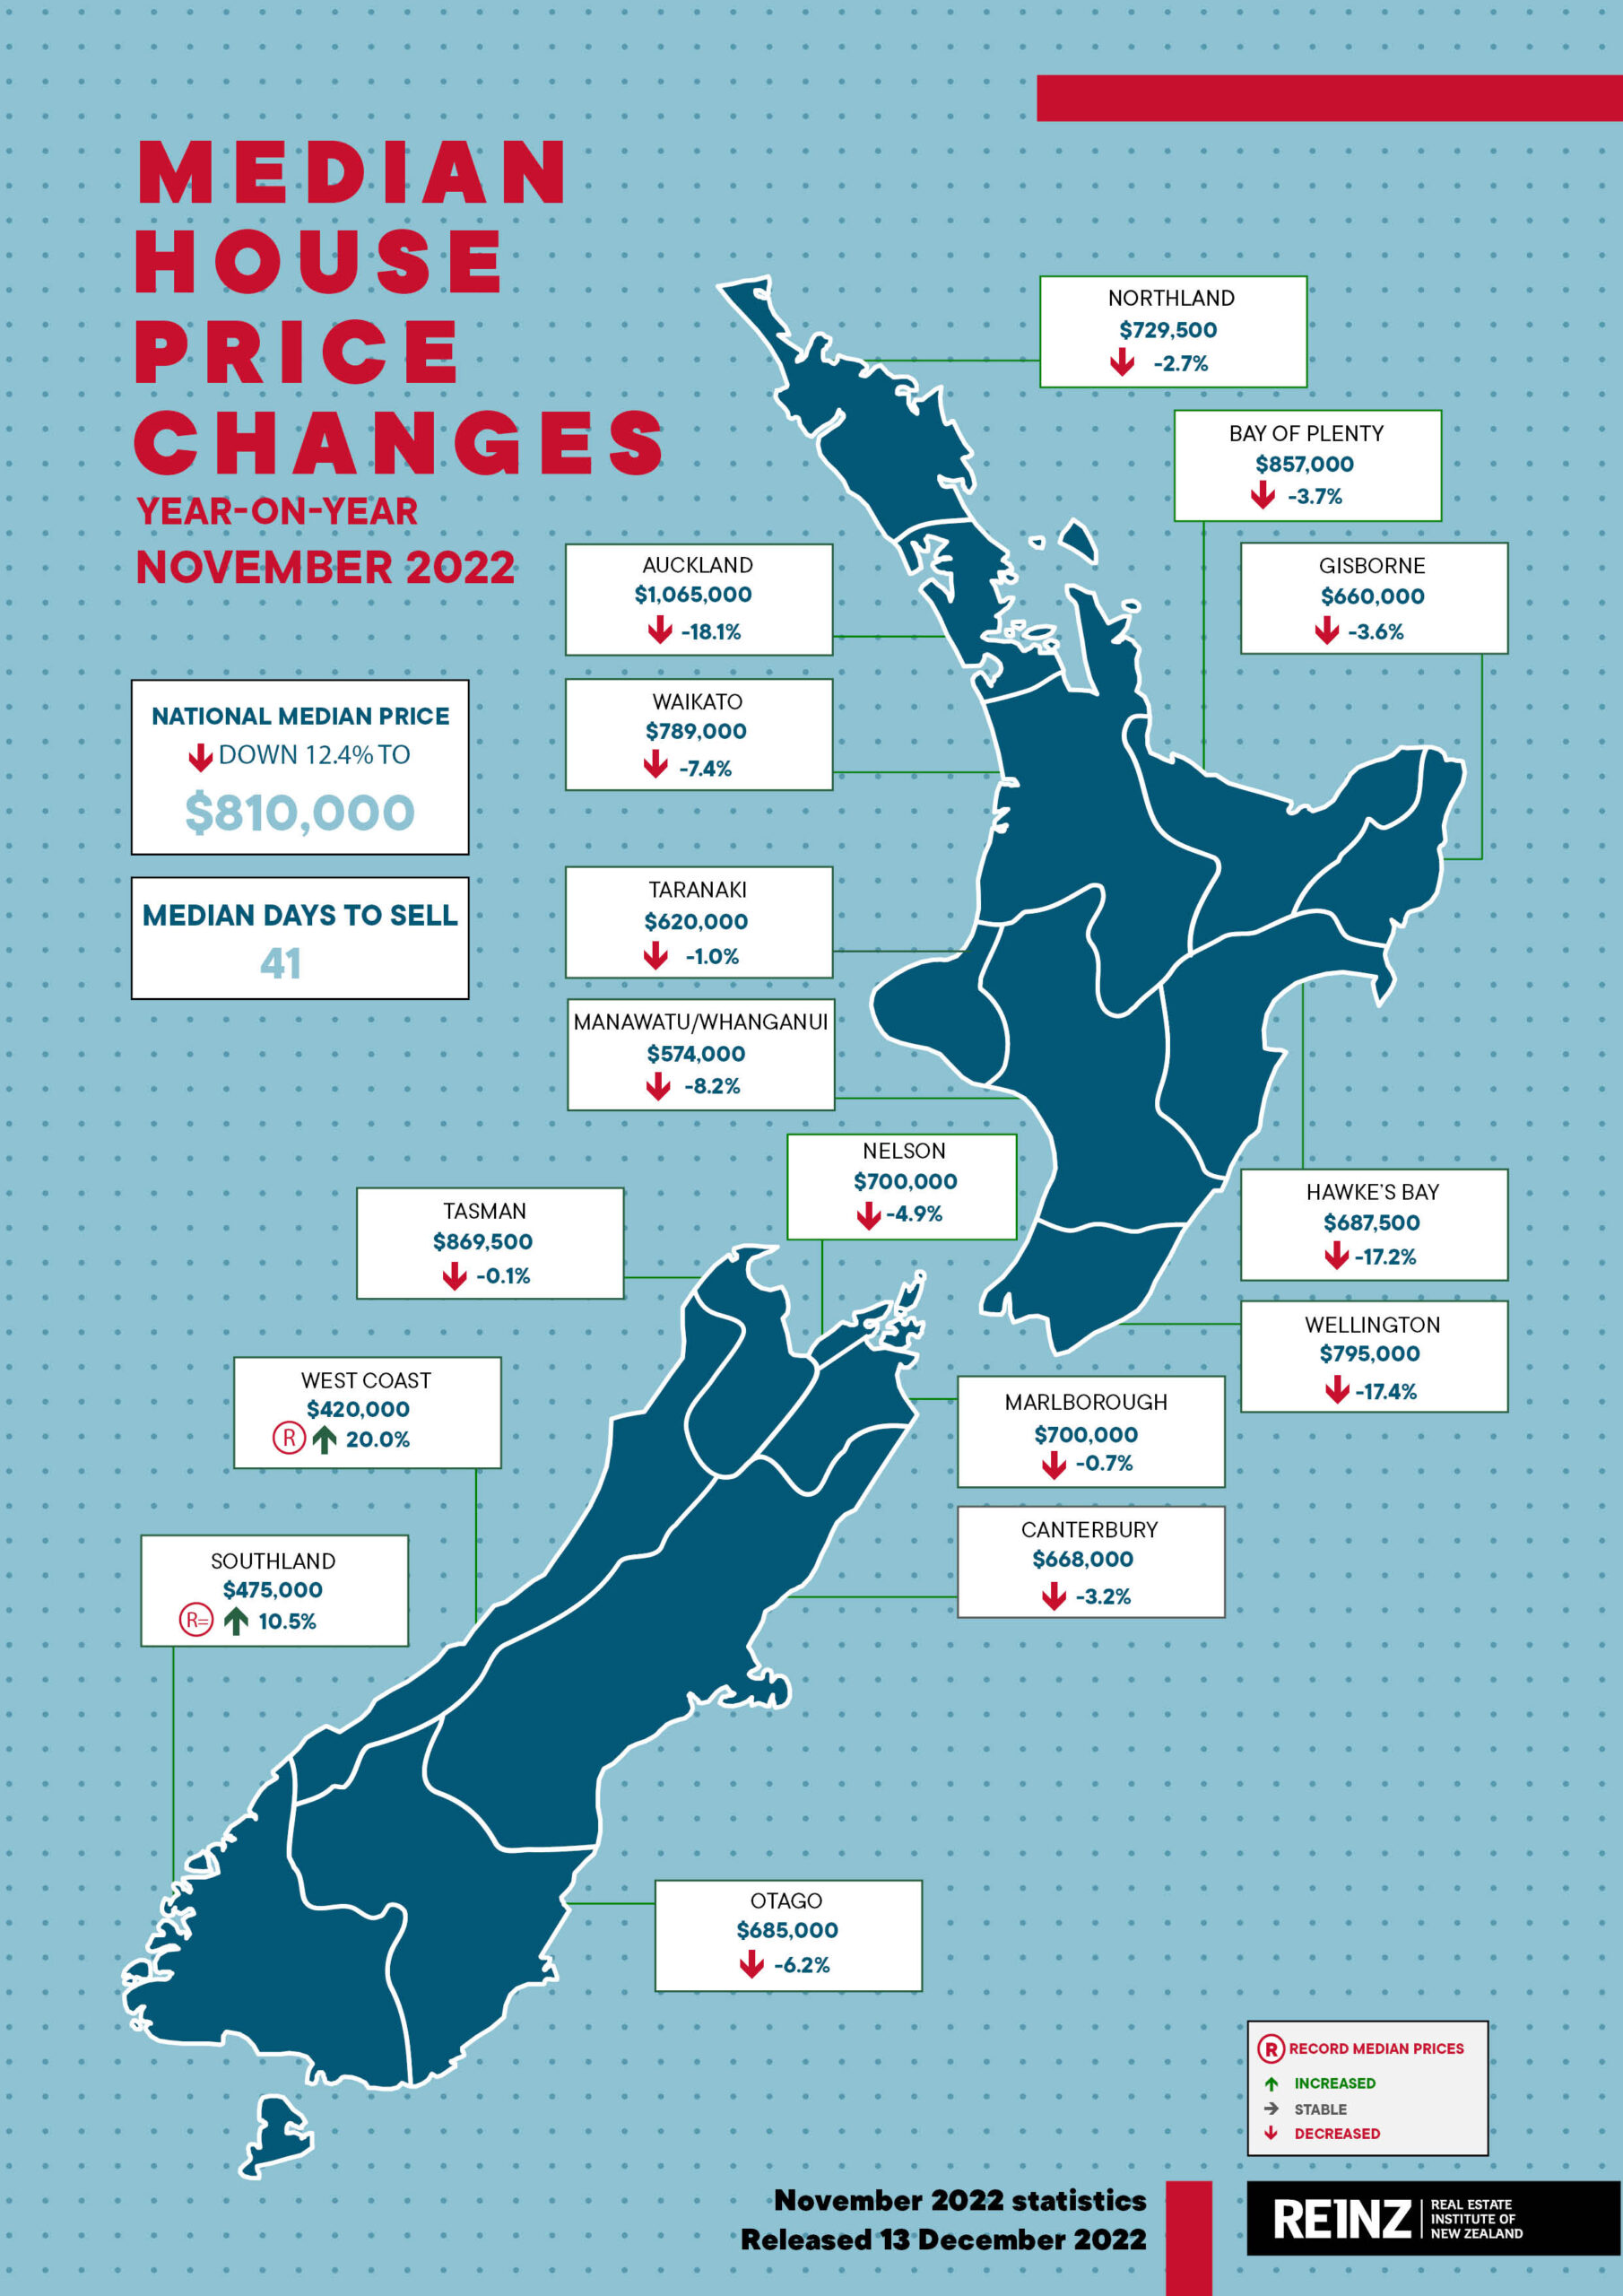
- Nationally, the median price for residential property decreased 12.4% annually
- West Coast achieved a record median price, up 20.0% annually to $420,000; Southland reached an equal high (last reached in February 2022) — up 10.5% annually to $475,000
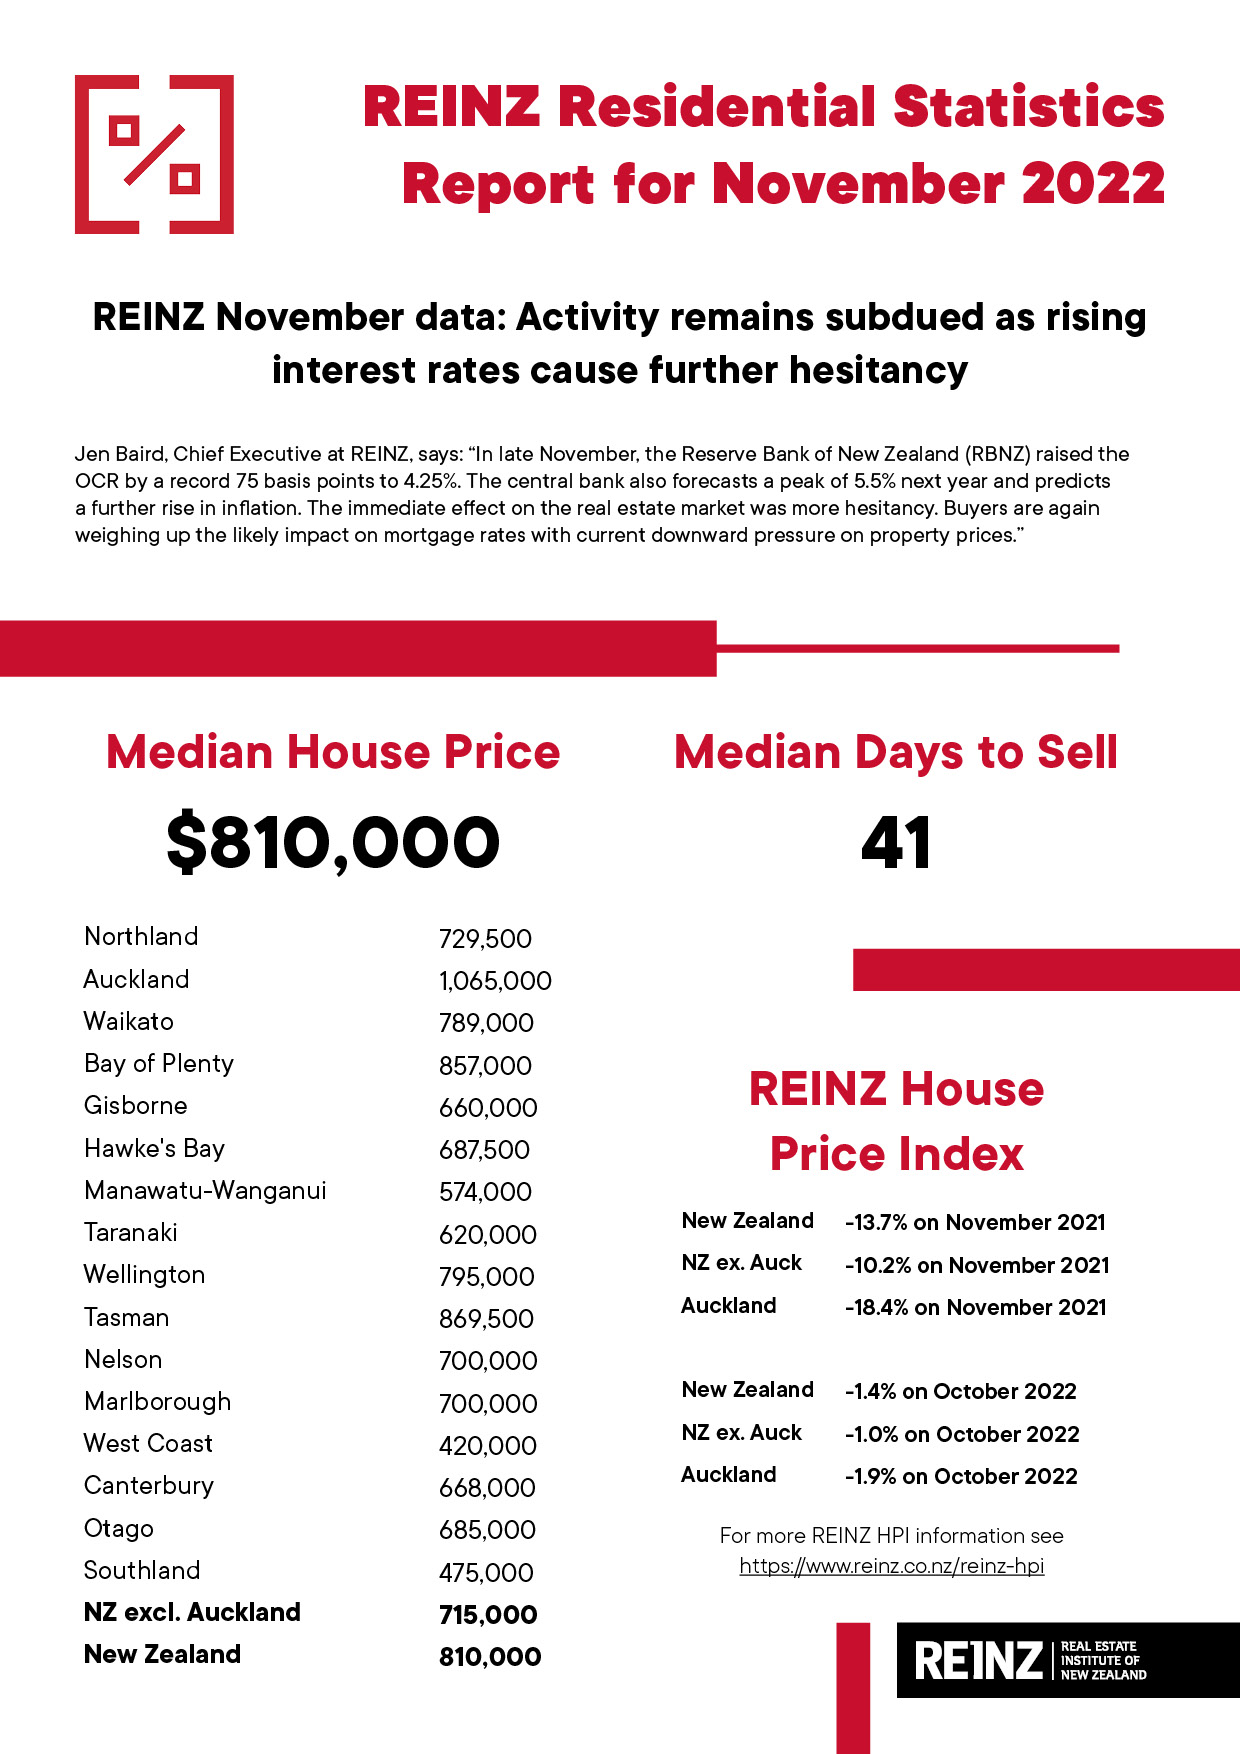
- The REINZ House Price Index (HPI) for New Zealand showed an annual decrease of 13.7% in the value of residential property nationwide
- At the end of November, 28,449 properties were available for sale across New Zealand — an annual increase in inventory of 47.7%
- Listings were down 26.0% annually to 10,185; except for Marlborough (no change), all regions saw listings decrease compared to November 2021
- The median number of days to sell a property in November was 41 — up 12 days annually
- The market peaked in November 2021; we’re comparing a market at its peak with one that has moderated over the past 12 months
Rising interest rates, access to finance and concerns around the economy have created uncertainty in the market. Across Aotearoa New Zealand, market activity through spring has been subdued and median prices continue to soften as buyers remain hesitant, according to the latest data and insights from the Real Estate Institute of New Zealand (REINZ), home of the most complete, accurate and up-to-date real estate data in New Zealand.
The number of residential property sales across New Zealand decreased annually by 36.1%, from 8,644 in November 2021 to 5,525 in November 2022. Month-on-month, there was an increase of 7.7%.
The sales count for New Zealand excluding Auckland decreased by 31.7% annually, from 5,462 to 3,728. Sales activity was up 5.6% compared to October 2022.
Sales counts in all regions declined compared to November 2021 — all had a double-digit percentage drop. The West Coast was the only region to see a decrease of less than 20% (down 15%, from 40 to 34). Three regions saw a decrease on October 2022: Gisborne (-10.5%), Wellington (-8.4%) and Taranaki (-1.6%).

The regions with the greatest annual percentage decrease were:
- Gisborne, which decreased 45.2% annually from 62 to 34
- Auckland, which decreased 43.5% annually from 3,182 to 1,797
- Manawatu/Whanganui, which decreased 39.1% annually from 414 to 252
- Wellington, which decreased 36.2% annually from 870 to 555.
Jen Baird, Chief Executive at REINZ, comments:
“When looking at the November figures, we’re comparing to a market at its peak with one that has moderated over the past 12 months.
“In a recent survey of REINZ membership, conducted with economist Tony Alexander, real estate professionals reported the top concerns of buyers in the market are high interest rates, access to finance and purchasing and seeing prices soften. Add to these concerns of recession, global economic and geo-political uncertainty.
“In late November, the Reserve Bank of New Zealand (RBNZ) raised the OCR by a record 75 basis points to 4.25%. The central bank also forecasts a peak of 5.5% next year and predicts a further rise in inflation. The immediate effect on the real estate market was more hesitancy.
“Buyers are again weighing up the likely impact on mortgage rates with current downward pressure on property prices. Those thinking of selling are again looking at the market and asking, ‘Is this the right time?’
“For many it is the right time. In November, people continued to transact — 5,525 according to our sales count,” Baird says.
Median price continues to soften
Across New Zealand, the median price for residential property (excluding sections) decreased 12.4% annually, from $925,000 in November 2021 to $810,000 in November 2022. Month-on-month, this represents a 1.2% decrease from $820,000 in October.
The median residential property price for New Zealand excluding Auckland, decreased 7.1% — from $770,000 to $715,000. There was a month-on-month decrease of 1.4% from $725,000 in October.
Fourteen of 16 regions had negative annual median price movements; last month, there were 12. This is the first time since January 2009 that 14 or more regions recorded negative annual median price movement. Six regions recorded negative monthly movements.
West Coast achieved a record median price, up 20.0% annually from $350,000 to $420,000. While Southland reached an equal high (last reached in February 2022) — up 10.5% annually to $475,000.
Auckland saw the greatest median price decrease — down 18.1% compared to November last year, from a record $1,300,000 to $1,065,000. All seven Auckland districts had negative movements, with Papakura down 24.8%, and Auckland City and Waitakere City down 22.7%.
In Wellington, the median price was down 17.4% annually, from $962,500 to $795,000 in November 2022. Six of the eight territorial authorities (TAs) in the region had negative median price movements. The Masterton District (+3.5%) and the Carterton District (+1.4%) saw annual increases, with Lower Hutt City (-26.6%) and Porirua City (-19.5%) seeing the greatest decreases in median price movement.
Three TAs achieved record median prices; in the West Coast the Buller District reached a median price record of $420,000, while in Southland the Gore District and Invercargill City reached record medians — at $435,000 and $485,000, respectively. More information on activity by region can be found in the regional commentaries section of the Monthly Property Report.
“While property prices have softened, and agents report hesitancy amongst buyers, we see indications sentiment is shifting. Agents around the country say sellers are realistic, they are meeting the market, they are entering negotiations. The most sought-after properties are well-presented and well-marketed.
“If you can make the finances work, this is a good time to be a buyer. Firstly, there is significantly more stock on the market. At the end of November, there were 28,449 properties available for sale across New Zealand — an annual increase of 47.7%.
“Secondly, the market is less competitive. While owner occupiers remain a strong presence, investors have largely stepped back — for now. Thirdly, we have seen prices come down 12.4% since their peak last November. Affordability will remain an influencing factor, but for those previously sidelined in last year’s quick-paced market now is a great time to take another look at what’s out there. The impact of increasing interest rates on mortgage serviceability will put pressure on people, but rates are likely to peak in 2023 and start to fall again.”
HPI: all regions see annual decrease in value of property
The REINZ House Price Index (HPI) for New Zealand, which measures the changing value of residential property nationwide, showed an annual decrease of 13.7% from 4,276 in November 2021 to 3,692.
New Zealand saw a 1.4% decrease in terms of month-on-month HPI movement.
For New Zealand excluding Auckland, the HPI decreased 10.2% annually — from 4,279 in November 2021 to 3,842 in November 2022.
All regions saw an annual decrease in HPI movement. Down 2.2% annually, Southland was the top-ranking region on the Index in November, followed by Otago (-3.4%) and Taranaki (-3.8%).
“In November, Wellington again had the greatest percentage decrease in the value of residential property — down 19.5% annually on the REINZ HPI. The region has ranked bottom of the Index for 12 consecutive months. However, we are seeing some positive indicators. When we look at HPI movement over the past three months, Wellington is the sixth best performer (at -2.1%), suggesting the intensity of downward pressure on property value is easing in the region,” says Baird.
Auckland had the second greatest decrease in HPI movement, with an annual decrease on the Index of 18.4%.

New Zealand’s median days to sell still high at 41
Across New Zealand, the median number of days to sell (DTS) a property in November was 41 — up 12 days compared to November 2021’s hyperactive market, and selling three days faster than last month.
For New Zealand excluding Auckland, DTS increased 12 days to 41 — though down three days compared to October.
Southland had the lowest DTS of all regions at 30, an annual increase of three days. Northland and Hawke’s Bay had the highest median DTS at 54.
“Median days to sell remain elevated, though down on last month — in part due to transactions taking longer to execute with more sales subject to finance or sale. However, real estate professionals also note buyer hesitancy as they weigh up mortgage rates and the gamble of prices softening post-purchase.”
New listings down, inventory levels easing
Nationally, listings were down 26.0% annually to 10,185. New Zealand excluding Auckland saw an annual decrease of 16.1%.
Except for Marlborough (no change), all regions saw listings decrease compared to November 2021, with five seeing decreases of 20% or more. Auckland had the greatest decrease in listings, down 39.8%, followed by Gisborne (32.9%), Wellington (24.7%) and Northland (21.5%).
At the end of November, the total number of properties available for sale across New Zealand was 28,449 — an annual increase of 47.7%, up from 19,260 in November 2021. For New Zealand excluding Auckland, it was 17,579 — an annual increase of 64.9%, from 10,661.
While two-thirds of all regions have an annual increase in inventory of at least 50%, only Nelson recorded an increase of over 100% compared to last November. In October, five regions had an annual increase over 100%.
“In line with seasonal expectations, we have seeing listings climb since the start of spring. November saw 10,185 new listings. However, this is an annual decrease of 26.0%.
“At the same time, there was an annual increase in the number of properties available for sale of 47.7% — sitting at 28,449 at months’ end.
“With decreasing demand and more supply on the market, able-buyers have the luxury of choice and time to make informed purchasing decisions.”
Inventory and listing data come from realestate.co.nz.
Auctions: seasonal uptick reflected in auction numbers
Nationally, 14.7% of properties (812) were sold at auction in November 2022, compared to 32.1% in 2021. New Zealand excluding Auckland saw 10.6% of properties (388) sell by auction, compared to 15.6% the year prior.
Auctions represented 35.3% of sales (12) in Gisborne, down from 58.1% in November 2021. In Auckland, 23.6% of sales were by auction (424) — compared to 51.4% at the same time last year.
“While the percentage of properties sold by auction remains low compared to the heights achieved through 2021, we are seeing an uptick in the data. In August 2022, 9% of properties were sold by auction across New Zealand, in November that figure sits at 14.7%.
“Salespeople in some regions — such as Gisborne and Central Otago — reported that auctions performed well. That said, compared to November last year, we have seen a significant drop in sales by auction. The potential of further increases to the OCR and concern around the impact on mortgage rates has caused hesitancy across the market, including in auction attendance. Anecdotally, there has been an increase the number of sales subject to finance or sale, resulting in an increase in other sales methods.”

MOST POPULAR
- Auctioneer refuses $500 bid on a house
- Jonah Lomu’s widow Nadene ‘moving on with life’ as a realtor
- Claims about Jacinda Ardern’s wealth
- Sir John reveals what it would take for housing market to ‘really crack’
- How 27-year-old owns four properties | WATCH
- Family paid $500k for modular home they may never receive
- Abandoned land for sale
- Yes, dreams do come true! How to become a real estate agent superstar
- How high are mortgage interest rates really going to go?
- Rugby union star Israel Folau’s $403K real estate victory


