PHOTO: Vanessa Williams, spokesperson for realestate.co.nz. FILE/GETTY
Post-election sugar rush wears off the property market
Lowest month on record for new listings*. Central Otago/Lakes District hits highest average asking price on record for any region – just shy of $1.6 million.
As most Kiwis wound down to their summer break, the New Zealand property market followed suit. Despite the post-election optimism felt in November, this spirit didn’t extend into the festive period. December brought a 16-year low in new listings, excluding April 2020, when COVID-19 lockdown restrictions paused house listings. This amounted to less than half the number of new listings compared to the previous month.
The latest data from realestate.co.nz also indicates stock and average asking prices remained below December 2022 levels nationally.
Vanessa Williams, spokesperson for realestate.co.nz, says:
“The summer break brings a different rhythm to the property market. We typically see a natural slowdown as people focus on festivities, time with their loved ones, and getting away to the beach.”
Despite the holiday respite, some regional hotspots showcased a different story, which Vanessa explains is down to diversity within our market. For example, in sun-kissed Coromandel, year-on-year new listings were up 21.9%, stock was up 35.6%, and average asking prices rose above $1 million after a November lull.
“Regions like Coromandel often display a unique resilience during the holidays. The allure of beachside living and holiday homes tends to keep activity buoyant during this time.”
“Moreover, the surge in new listings in this region suggests vendors were capitalising on higher visitor numbers,” says Vanessa.

Santa brings record national new listing low
Festive cheer may have been high, but new listings hit a new low during December, down 6.4% year-on-year to 4,828 new listings nationally. This marked the lowest month on record, excluding the national COVID-19 lockdown period.
New listings in Auckland mirrored the national trend with a 16-year record low. Down 11.7% to 1,392 new listings, Auckland had fewer listings in December 2023 than in April 2020, when COVID-19 lockdowns restricted the market.
Vanessa says while it’s not unusual to see a December dip, the decrease is more significant than usual:
“The last time we saw levels like this was December 2019, when nationally, there were only 5,528 listings and just 1,422 in Auckland. It starkly contrasts the more than 10,000 new listings which hit the market just a month earlier in November.”
She adds that some vendors may be holding off on listing until the New Year because they aim to sell via auction, which is typically rare during the Christmas break. Selling via auction has been rising in popularity in recent months.
Across the country, 11 of our 19 regions saw new listings decline. The biggest decreases were in Gisborne (down 32.1% year-on-year to 19 new listings) and Taranaki (down 26.1% year-on-year to 136 new listings).
On the flip side, Coromandel (up 21.9% year-on-year to 117 new listings) and Marlborough (up 14.5% year-on-year to 79 new listings) saw the biggest increases.
“Like Coromandel’s sun-kissed beaches or Marlborough’s prized Sauvignon Blanc, vendor activity lit up the market in these regions during December,” says Vanessa.
She adds that the diversity among the regions highlights how different areas navigate the festive season.

National stock takes a summer dip, but some buoyancy remains outside of main centres
Down 4.6% year-on-year, national stock levels took a dip last month. This trend, typical during year-end celebrations, predominantly affected major centres like Auckland, Waikato, Bay of Plenty, Canterbury, and Otago. However, Gisborne had the biggest drop with only 74 properties on the market, a year-on-year drop of 30.6%.
Many places painted a different picture, with nine of our 19 regions seeing stock levels increase compared to December 2022. Coromandel and Central North Island led the charge with year-on-year stock increases of 35.6% and 27.1%, respectively. Stock also increased in Southland (up 17.3%), Northland (up 15.9%), Nelson & Bays (up 11.0%), Marlborough (up 7.9%), Taranaki (up 5.8%), Central Otago/Lakes District (up 3.9%), and West Coast (up 2.8%).
Vanessa says this highlights the various ‘microclimates’ within the New Zealand property market:
“While the main hubs experienced a typical seasonal downturn, the stock increases in regions like Coromandel and Central North Island show that seasons can affect regions differently.”
“While some areas hit pause for summer, others hit play,” says Vanessa.

Average asking prices are a mixed bag, driven by the regions.
December’s average asking prices were mixed, with regional New Zealand continuing to drive the market. Standing out amidst the holiday slowdown, Central Otago/Lakes District, Nelson and Bays, Taranaki, Wairarapa, and West Coast saw both month-on-month and year-on-year growth to average asking prices in December.
Central Otago/Lakes District also reached an unprecedented high in December, with the highest average asking price for any region of $1,590,855, a 16.2% year-on-year increase.
“Central Otago/Lakes District is a lifestyle region. Despite its distance from major business hubs, it boasts the highest average asking price in the country.”
“The average asking price in Central Otago/Lakes District is around half a million dollars more than in Auckland,” says Vanessa.
*Excluding the COVID-19 lockdown in April 2020.

Glossary of terms:
Average asking price (AAP) is neither a valuation nor the sale price. It is an indication of current market sentiment. Statistically, asking prices tend to correlate closely with the sales prices recorded in future months when those properties are sold. As it looks at different data, average asking prices may differ from recorded sales data released simultaneously.
New listings are a record of all the new residential dwellings listed for sale on realestate.co.nz for the relevant calendar month. The site reflects 97% of all properties listed through licensed real estate agents and major developers in New Zealand. This description gives a representative view of the New Zealand property market.
Stock is the total number of residential dwellings that are for sale on realestate.co.nz on the penultimate day of the month.
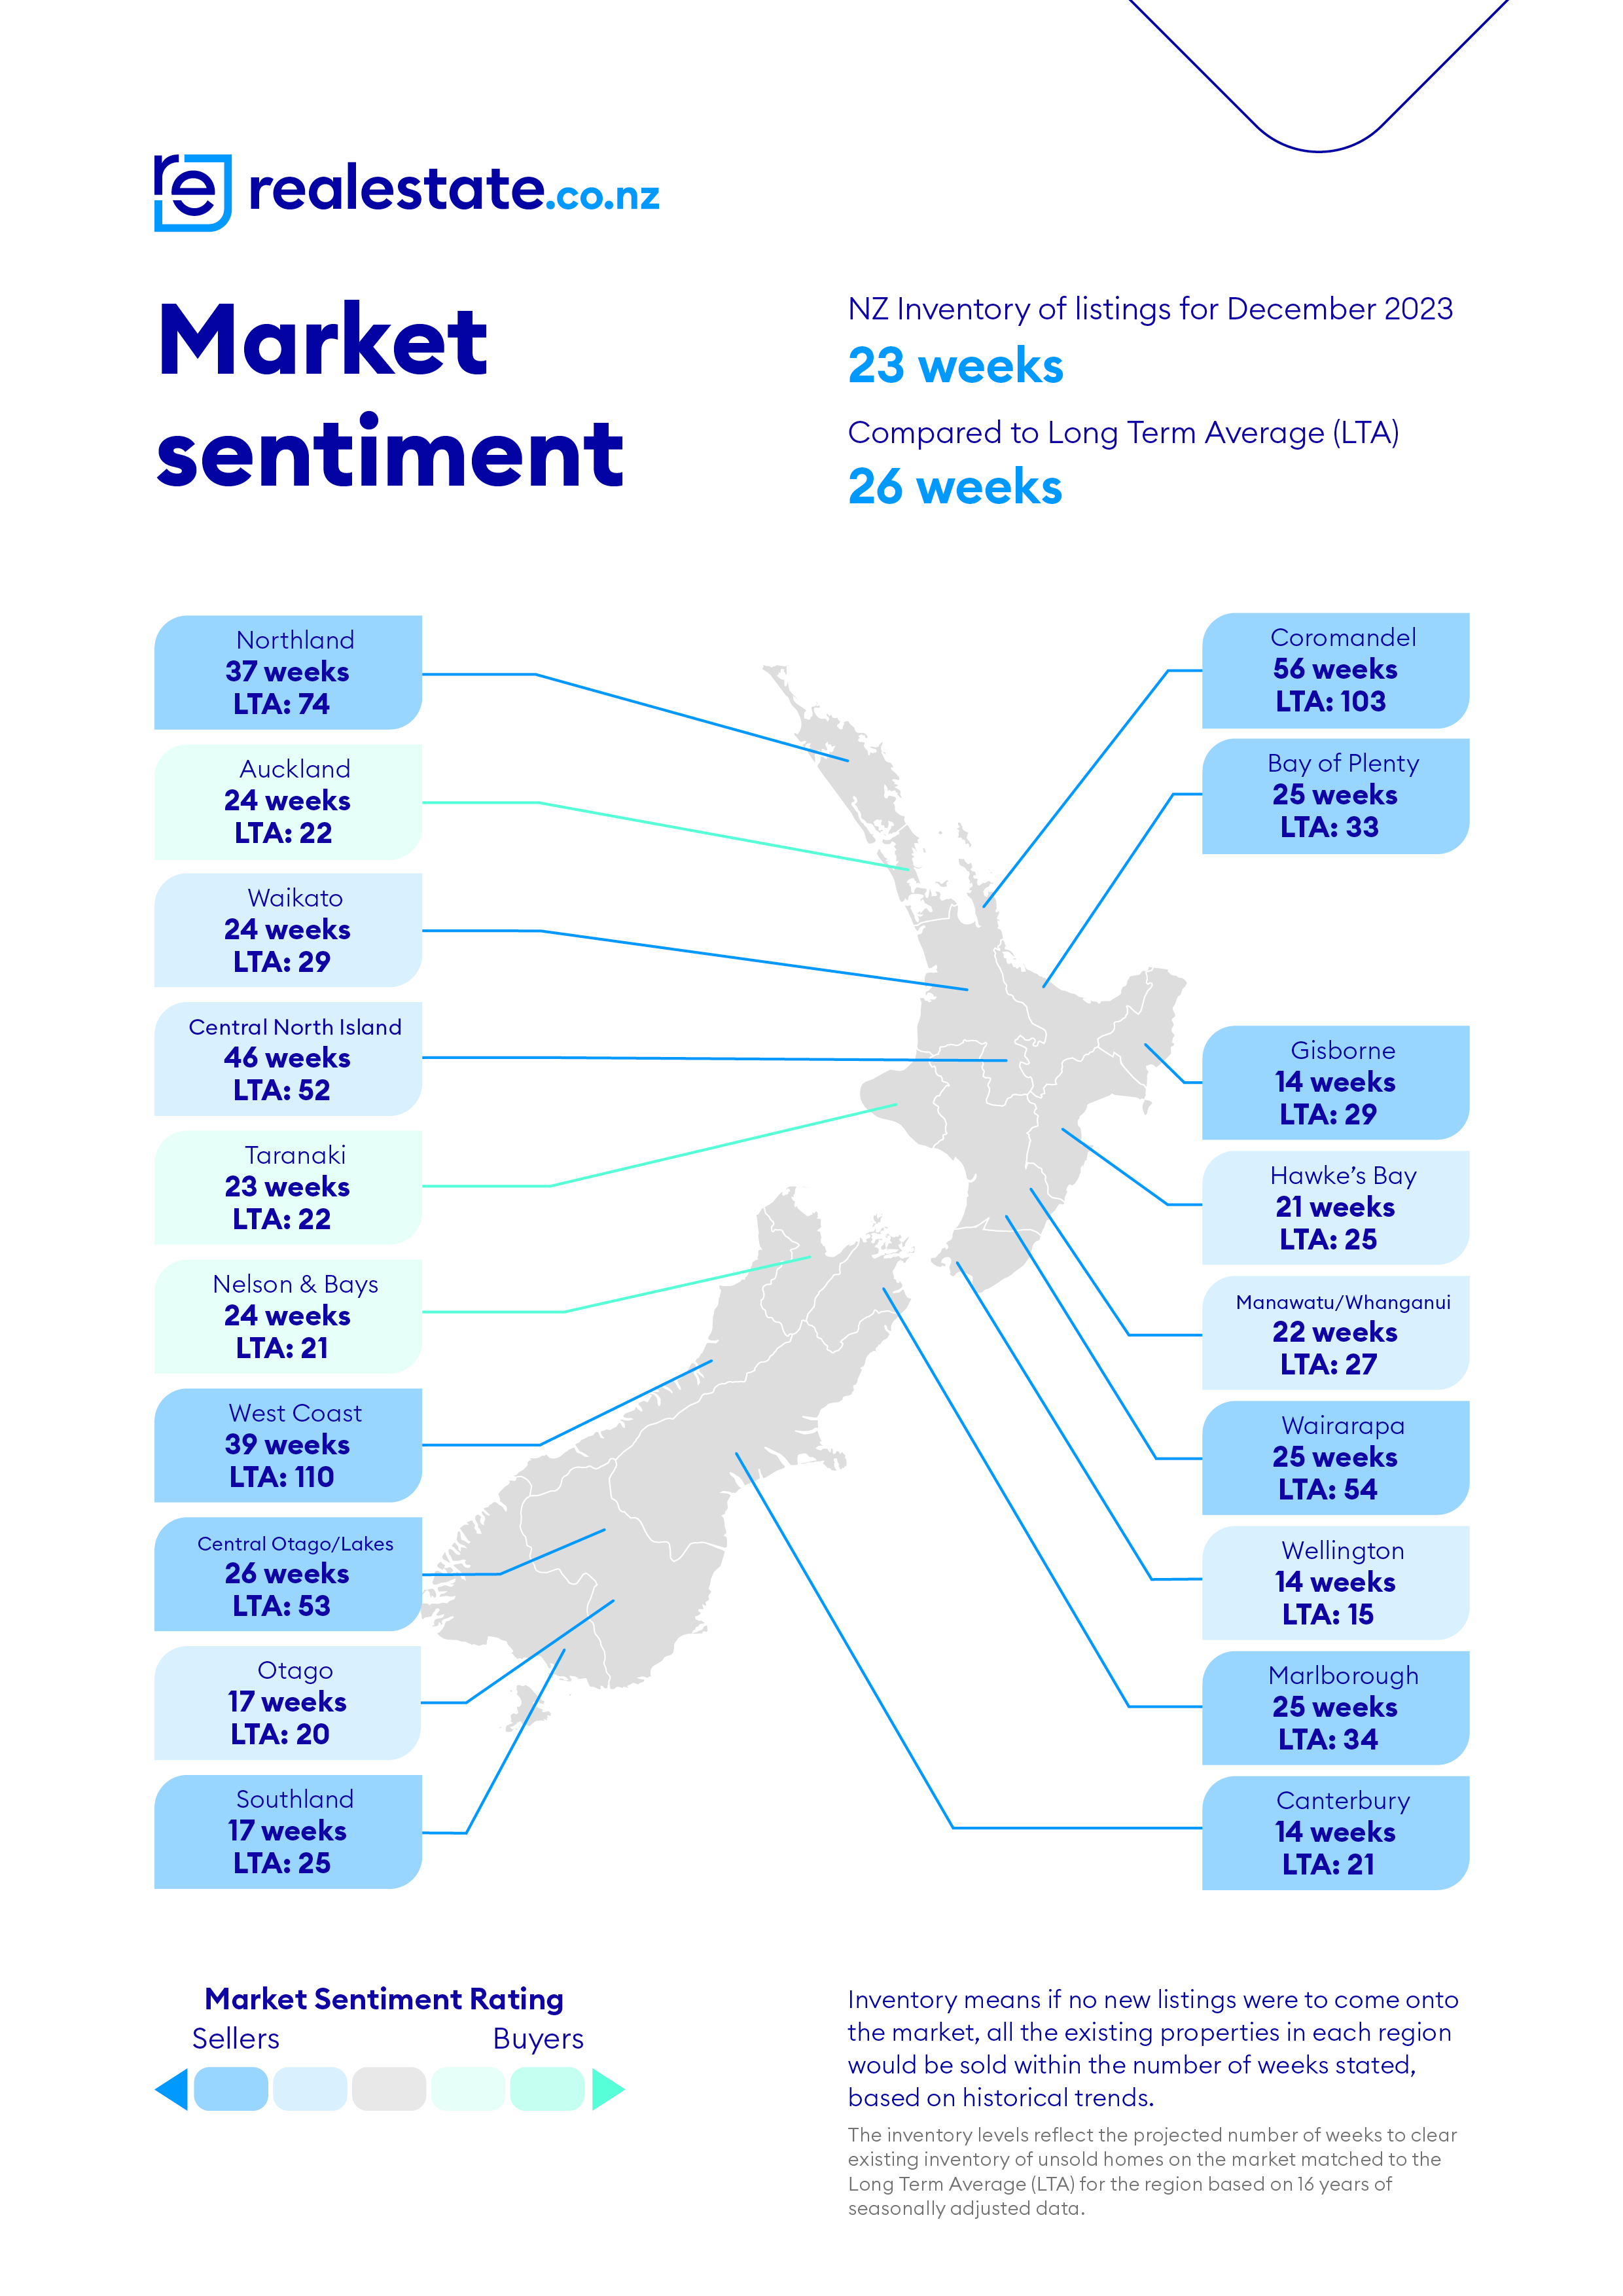
Inventory is a measure of how long it would take, theoretically, to sell the current stock at current average rates of sale if no new properties were to be listed for sale. It provides a measure of the rate of turnover in the market.
Demand measures the level of serious buyer interest compared to the available supply. It does this by tracking two related datasets – searches and engagements per listing. Searches per listing divides the total number of searches on realestate.co.nz by stock. Engagements per listing divides the total number of enquiries and property saves by stock.
Seasonal adjustment is a method realestate.co.nz uses to represent better the core underlying trend of the property market in New Zealand. This is done using methodology from the New Zealand Institute of Economic Research.
Truncated mean is the method realestate.co.nz uses to supply statistically relevant asking prices. The top and bottom 10% of listings in each area are removed before the average is calculated to prevent exceptional listings from providing false impressions.


