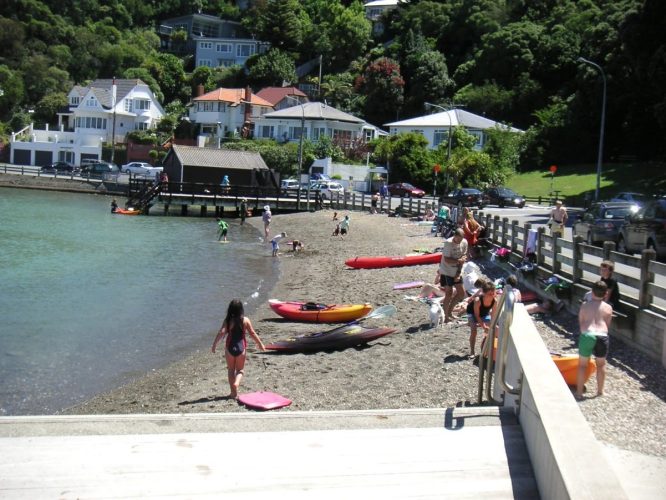
PHOTO: NZ Property Market
When it comes to trying to develop an understanding of what is happening to the New Zealand housing market – you will hear all sorts of so called experts tell you all sorts of things. They of course like you are entitled to their opinion. Many are self serving – trying to talk up or down the market to support their cause.
Regardless of whether you think the property market will perform well or not post Level 4 Lockdown – there is one key statistic that doesn’t lie and is the critical KPI (Key Performance Indicator) when it comes to the property market. Mortgage Application numbers.
The Reserve Bank of New Zealand (RBNZ) publish Mortgage Application numbers each month.
The next set of figures come out – 29 April 2020 3:00 p.m. These figures will tell you how many mortgages have been applied for versus this time last year, broken down into the different buyer types.
RELATED: Will the New Zealand Housing Market Crash in 2020?
In simple language – less mortgage applications mean less sales – less sales mean less demand – less demand mean prices will will come back. If you disagree with that then – you have your head in the sand.
So will there be less mortgage applications in March/April? Yes
Will there be less mortgage applications post COVID-19 Lockdown? Let’s wait and see. We believe there will be.
Here are the current numbers:
Previous years: | Monthly: | ||||||
|---|---|---|---|---|---|---|---|
| Feb 2018 | Feb 2019 | Oct 2019 | Nov 2019 | Dec 2019 | Jan 2020 | Feb 2020 | |
| Total lending ($million) | |||||||
| All borrower types | 4,667 | 4,798 | 6,077 | 6,796 | 6,539 | 4,714 | 5,579 |
| First home buyer | 727 | 810 | 1,102 | 1,243 | 1,209 | 889 | 938 |
| Other owner occupier | 2,856 | 3,057 | 3,709 | 4,119 | 3,977 | 2,811 | 3,448 |
| Investor | 1,036 | 886 | 1,196 | 1,363 | 1,298 | 951 | 1,135 |
| Business purposes | 48 | 46 | 70 | 71 | 55 | 63 | 58 |
| Higher than 80% LVR lending ($million) | |||||||
| All borrower types | 363 | 495 | 615 | 690 | 724 | 508 | 562 |
| First home buyer | 222 | 325 | 429 | 483 | 482 | 358 | 371 |
| Other owner occupier | 137 | 166 | 181 | 202 | 235 | 144 | 186 |
| Investor | 4 | 4 | 5 | 4 | 5 | 6 | 4 |
| Business purposes | 0 | 0 | 0 | 1 | 1 | 0 | 2 |
| Less than or equal to 80% LVR lending ($million) | |||||||
| All borrower types | 4,304 | 4,304 | 5,462 | 6,106 | 5,816 | 4,206 | 5,017 |
| First home buyer | 505 | 485 | 673 | 760 | 727 | 531 | 567 |
| Other owner occupier | 2,719 | 2,891 | 3,528 | 3,917 | 3,742 | 2,667 | 3,262 |
| Investor | 1,032 | 882 | 1,191 | 1,359 | 1,293 | 945 | 1,131 |
| Business purposes | 48 | 46 | 70 | 70 | 54 | 63 | 56 |
| MEMO ITEM: Lending to investors ($million) | |||||||
| Total lending | 1,036 | 886 | 1,196 | 1,363 | 1,298 | 951 | 1,135 |
| Higher than 70% LVR lending | 137 | 137 | 186 | 204 | 196 | 139 | 159 |
| Less than or equal to 70% LVR lending | 899 | 749 | 1,010 | 1,159 | 1,102 | 812 | 976 |
Property Noise – OPINION PIECE


