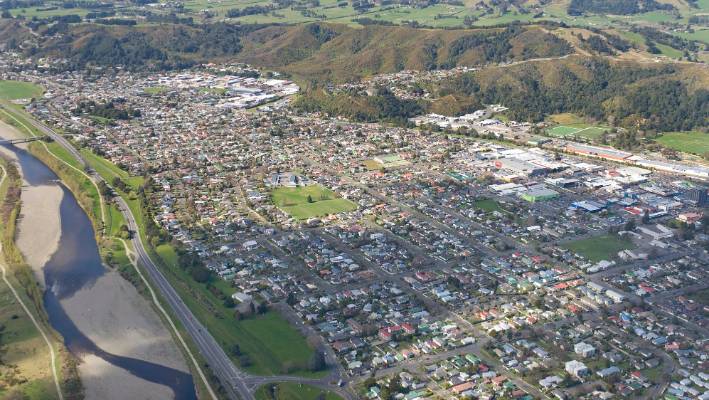
PHOTO: Upper Hutt, Wellington. FILE
Decreasing rate of NZ house price falls probably a false dawn
Aotearoa New Zealand’s housing market downturn appeared to lose further momentum over the final months of 2022, however additional interest rate rises in the first half of the year is likely to lead to ongoing weakness in the property market in 2023.
CoreLogic’s House Price Index (HPI) shows property values fell -0.2% in December, a further reduction in the pace of price declines from previous months (-0.6% in November and -1.3% in October).
December’s fall means values were down -5.0% nationally over the calendar year, leaving the average house price at $956,000 after starting the year at $1,007,000.
CoreLogic NZ Head of Research Nick Goodall said it was a significant turnaround after the market grew by 27.6% in 2021. It’s also the largest annual decline since June 2009 (-6.4%), when the market was still in retreat from the Global Financial Crisis.
“The CoreLogic HPI indicates New Zealand’s property market peaked in March with the first monthly fall in prices recorded in April,” Mr Goodall said.
“Since then we’ve seen the rate of decline accelerate as the official cash rate climbed higher and affordability constraints kicked in. However, during the last quarter of 2022 there were some signs of light at the end of the tunnel as expectation of further interest rate increases diminished.
“Ultimately though, these were extinguished following the persistently high CPI inflation result for Q3 (7.2%p.a), which brought a refreshed and much higher OCR forecast peak, along with increased economic uncertainty.
2023 PRICING: Profile YOU on this website! – FOR 12 MONTHS | ONLY $999 plus GST
“We don’t expect this to signal the bottom of the downturn by any means, particularly given the outlook for further rate increases in the first half of this year. This will restrict borrowing capacity and until rates stabilise we should be prepared to see further declines in value this year.”
During COVID, New Zealand recorded a national increase in average house prices of 41% over the 19 months from trough (August 2020) to peak (March 2022).
CoreLogic House Price Index – National and Main Centres
| Change in property values | Average Value | |||
| Month | Quarter | Annual | ||
| New Zealand | -0.2% | -2.1% | -5.0% | $956,383 |
| Auckland | -0.3% | -2.4% | -5.1% | $1,354,801 |
| Hamilton | -0.2% | -2.4% | -5.4% | $836,018 |
| Tauranga | 0.1% | -2.7% | -5.7% | $1,074,336 |
| Wellington | -0.3% | -5.0% | -16.9% | $935,215 |
| Christchurch | -0.4% | -0.6% | 1.0% | $751,901 |
| Dunedin | -0.2% | 0.1% | -9.5% | $646,156 |
The moderate scale of value change was relatively consistent across the main centres with the monthly variation ranging from a 0.1% increase in Tauranga to a -0.4% fall in Christchurch.
In Dunedin, the -0.2% fall in December marks the fourth month in a row where values have hardly moved, which sees the average property value now 0.1% higher than three months ago. With values – 9.5% below the same time last year and recording consistent monthly changes in value, the market may be closer to finding a floor in Dunedin.
CoreLogic House Price Index – Main Centre Average Value
Despite Christchurch experiencing the (marginally) worst performance of the main centres in December, it remains the most robust centre when analysing over the longer period of time with the average value at the end of 2022 1.0% above the same time a year ago.
Meanwhile homeowners in the Wellington Area will welcome the news that the rate of decline in values has moderated, after average property values fell 16.9% over the calendar year.
CoreLogic House Price Index – Wellington
| Change in property values | Average Value | |||
| Month | Quarter | Annual | ||
| Kāpiti Coast | -1.2% | -5.3% | -12.1% | $865,338 |
| Porirua | 1.1% | -4.9% | -16.4% | $835,957 |
| Upper Hutt | -1.3% | -5.8% | -20.2% | $757,214 |
| Lower Hutt | 1.2% | -4.2% | -18.9% | $812,964 |
| Wellington City | -1.0% | -5.2% | -15.6% | $1,062,247 |
Mr Goodall said the volatility across the Wellington Area illustrated a market going through turbulence, with more on the horizon.
“Porirua’s values bounced back 1.1% over the month, after a fall of -4.7% in November which shows there’s still a lot of uncertainty across the city as buyers and sellers try to adjust their expectations following a period of rapid downward movement,” Mr Goodall said.
Lower Hutt values also saw a bounce, while the Upper Hutt City, Kāpiti Coast District and Wellington City all saw recent negative momentum continue – with values falling by 1.0% or more over the month.
2023 PRICING: Profile YOU on this website! – FOR 12 MONTHS | ONLY $999 plus GST
CoreLogic House Price Index – Auckland
| Change in property values | Average Value | |||
| Month | Quarter | Annual | ||
| Rodney | -0.1% | -2.2% | -0.2% | $1,324,200 |
| North Shore | 0.2% | -2.2% | -5.3% | $1,508,863 |
| Waitakere | -0.7% | -2.5% | -6.1% | $1,076,043 |
| Auckland City | -0.2% | -2.1% | -4.8% | $1,567,028 |
| Manukau | -0.5% | -2.5% | -6.7% | $1,209,319 |
| Papakura | -0.4% | -4.2% | -3.9% | $981,947 |
| Franklin | -2.4% | -4.0% | -4.1% | $954,158 |
The variability of value change wasn’t as evident across Auckland, Mr Goodall said, with only Franklin (-2.4%) bucking the broader trend of moderate change in December. The small lift in North Shore (0.2%) values also draws attention but should be considered with some caution until there’s consistency in consecutive data. Values for North Shore are down -2.2% over the final quarter of the year and similar to Waitakere, Auckland City and Manukau.
Regional House Price Index results
CoreLogic House Price Index – Other Main Urban Areas (ordered by annual growth)
| Change in property values | Average Value | |||
| TA | Month | Quarter | Annual | |
| Palmerston North | -1.4% | -4.4% | -12.1% | $659,450 |
| Napier | 1.6% | -0.8% | -9.5% | $798,075 |
| Whanganui | 1.3% | -1.6% | -8.5% | $521,708 |
| Hastings | -0.6% | -1.0% | -8.4% | $806,033 |
| Nelson | 0.1% | 0.0% | -6.9% | $812,828 |
| Rotorua | 0.5% | -1.2% | -2.8% | $684,276 |
| Invercargill | 1.1% | -0.2% | -1.5% | $461,444 |
| Whangārei | -0.4% | -0.2% | -1.5% | $798,791 |
| Gisborne | 2.3% | 2.0% | 0.2% | $642,500 |
| New Plymouth | -1.5% | -1.2% | 2.7% | $722,953 |
| Queenstown | -0.9% | -0.6% | 6.6% | $1,672,013 |
When analysing the markets outside the main centres, Mr Goodall said the theme of variable change in December encapsulates the other main urban areas across the country.
“Once again those experiencing noticeable lifts in value should be treated with caution as it may partly reflect the false dawn of positivity regarding the market, before the renewed warnings of economic weakness expected in 2023 alongside the increased peak of the OCR,” he said.
Palmerston North and New Plymouth recorded the greatest falls in December, though over the longer term measure their positions couldn’t be starker. The average value in New Plymouth remains 2.7% higher than a year ago, while values in Palmerston North have fallen -12.1% since the start of 2022, the worst performer among the regional house markets and the city’s largest annual fall on record.
Queenstown values meanwhile continue to hold up, despite some weakness seen in December. Values remain 6.6% higher than the beginning of the year, as tourism returns and the beauty of the region continues to appeal.
2023 PRICING: Profile YOU on this website! – FOR 12 MONTHS | ONLY $999 plus GST
Outlook for NZ housing values
In summarising 2022’s performance, Mr Goodall said the market’s volatility could suggest some buyers were trying to pick the bottom of the market.
“Anyone who bought in the last few months would likely have expected further falls, however there was a feeling of relative positivity surrounding the market prior to the higher-than-expected Q3 inflation figure being released. No one expected the OCR to have fully peaked though, so buyers were knowingly entering a market with further to fall,” he said.
“Further information has led the Reserve Bank of New Zealand (RBNZ) to forecast inflation will remain stubborn, thus necessitating a higher peak to the OCR and ultimately a recession. This probably means a continued constraint on property demand and subsequently further value falls, for longer.”
Encouragingly for the RBNZ (and its inflation outlook), there have been some signs that consumers in NZ have started to reign in their spending with comparisons to the previous year’s Christmas retail figures showing only a minor lift, which could be attributed to an increase in the cost of goods rather than people buying more things.
The future for the property market following the expected peak of the OCR of 5.5% in April/May and hopeful taming of inflation, then rests on the economic health of the country. If the recession hits, but is minor and with limited job losses, interest rates may plateau. If the economy is hit worse than expected, we may see interest rates start to fall as the RBNZ sees a need to stimulate activity.
Lastly, suggestions that median asking prices were showing renewed market growth, Mr Goodall warned: “These reports should be treated with caution as the measure does not account for the changing mix of properties which happened to be listed at any point in time. The same should be noted for median sales prices as they’re reported over the coming weeks, particularly with reduced sales volumes occurring over the holiday period.”
For more property news and insights, visit corelogic.co.nz.


