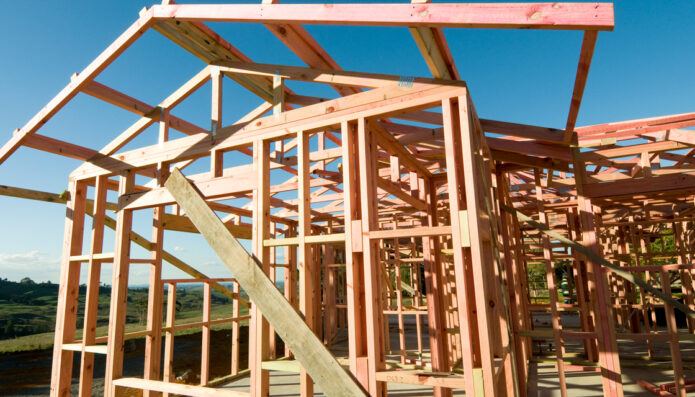
PHOTO: First home buyers. Image by rawpixel.com
According to STUFF in 1990 the “Misery Index” might have hit peak miserable, but there was something that was not a cause for despair: house affordability.
A week ago, Stuff used Misery Index scores to compare 2022 with 1990, which was the last year inflation hit its current highs.
The Misery Index is an American invention, and is the sum of unemployment and inflation, both expressed as a percentage.
In June 1990, New Zealand’s misery index score was 15.2%, made up of 7.6% unemployment and 7.6% inflation, compared to 10.6% in June 2022, made up of 3.3% unemployment, and 7.3% inflation.
But Nick Goodall, head of research at property research company CoreLogic, reckons Misery Index scores miss a vital part of the picture.
That is housing affordability, and Goodall set out to trawl through the data to see whether housing would change perspectives on the debate of whether 1990 or 2022 was worse.
CoreLogic’s data goes back to 1990, and Goodall found that even despite higher mortgage rates in 1990, when home loans were all variable rate loans, homes were far more affordable.
In mid-1990, the average house cost $125,440, a mere 3.2 times the average household’s income of $39,796.
Now, the average house costs $977,158, 8.2 times the average household’s income of $119,474.
Smaller mortgages were more affordable mortgages, even though mortgage interest rates were higher in 1990, Goodall said.
However, 1990 was a plumb centre of a multi-year period of high unemployment, especially amongst Māori, and fears of redundancy stalked workers, so opportunities to buy homes at what now look like bargain prices was not evenly spread across the population.
But for those who could buy, the cost of servicing a mortgage, where the owner had 20% equity, on an average house for an average household still only consumed 23% of its income, Goodall said.
In 2022 the average household with the same level of equity would be paying 51% of their income to service a mortgage on the average house, he said.
Another measure of house affordability was the number of years it took to save a deposit. Using the same set of assumptions, in 1990, it took 4.2 years, compared to 10.9 years now.

Though the house affordability data provides a fresh perspective on the 1990 versus 2022 debate, it could not the whole story, Goodall said.
Attitudes to debt had changed, he said. The employment outlook was much more rosy now for people than in 1990. Mortgagee sales were at record lows.
Goodall, who was seven years old in 1990, said a recent Treasury paper set out the reasons why housing affordability declined so starkly.
The Treasury’s Housing Technical Working Group, a joint initiative of The Treasury Te Tai Ōhanga, The Reserve Bank Te Pūtea Matua, and Ministry of Housing and Urban Development Te Tūāpapa Kura Kainga, was established to improve our technical understanding of the housing market.
MOST POPULAR
 The Block Australia star dies
 HOUSING SHOCK: ANZ warns house prices will fall at least 27%
 HOUSING CRISIS: Becoming a real estate agent is no longer a popular choice
 Rich-list split among magnificent multi million-dollar real estate
 DISRUPTOR: Brothers behind $8 Billion luxury real estate firm cut commission to 1%
 Claims about Jacinda Ardern’s wealth
 Neil Finn sells his mansion | WATCH
 100 Most Influential Real Estate Agents | NOW LIVE
 Waterfront property that comes with a gang boss
 You thought AUCKLAND is expensive: ‘Surprised’ owner gets $5m for cottage


