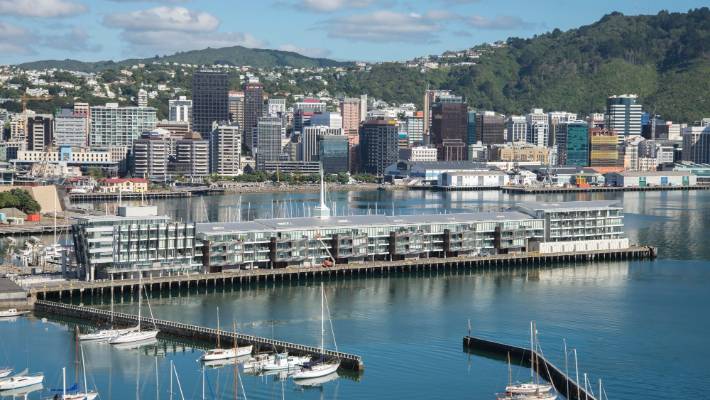
PHOTO: Wellington, NZ FILE
| By Kelvin Davidson, Chief Property Economist, CoreLogic New Zealand
Across the wider Wellington area, including the City, Upper & Lower Hutt, and Porirua, the past five to six years have brought large increases in property values, following a reasonably long flat patch prior to 2015. Factors for this have included strong and broad-based demand (including first home buyers) and a comparatively low new supply pipeline. However, the flipside is that affordability has deteriorated markedly and it seems fair to suggest that this could result in a period of outperformance soon giving way to a more sluggish medium-term outlook. |
| Wellington’s property market has been on a prolonged upswing since 2015 and if anything that boom has intensified over the past nine to 12 months (post-COVID). What’s been going on lately and does it tell us anything about future prospects?
Starting with average values themselves, in June 2015 the figure for wider Wellington (defined here as City, Porirua, Lower Hutt, Upper Hutt) was $459,751. Now, only six years later, the number has jumped to $1,024,649 – a rise of 123%, or $564,898. As the first chart shows, each of those sub-markets has risen strongly over the full six years since 2015, but even more so in the past 12 months. Even the ‘cheapest’ market in Upper Hutt now has an average property value of more than $850,000. In terms of the drivers for that upturn, demand for housing has certainly been strong, and broad-based – our Buyer Classification data shows that (like other parts of the country) mortgaged investors have been pretty active, but there’s also been a high presence for first home buyers across wider Wellington (see the second chart). Part of that dynamic is likely to have been people working in higher-paid Wellington City jobs but commuting in (or working from home) from their first home further afield in Lower or Upper Hutt, or Porirua. To be fair, population growth in these parts of the country hasn’t been as strong as elsewhere, but even so the supply of property hasn’t really kept pace. Listings are tight across wider Wellington and although new dwelling consents have been rising, they’re still low per capita when compared to NZ as a whole (see the third chart). There’s no denying that Wellington’s geography makes it more difficult than elsewhere (e.g. Canterbury) to significantly scale-up the new housing supply pipeline. In turn, the strong rise in property values has seen housing affordability deteriorate – for example, years to save a deposit is eight to nine in each of these sub-markets (all record highs), and the shift in Lower Hutt has perhaps been the most stark. As the fourth chart shows, its measure has typically been quite a long way below Wellington City in the past – but not anymore. Meanwhile, mortgage payments as a share of household incomes are above average too (even despite low mortgage rates), whereas the NZ-wide figure is below average. In a nutshell, Wellington’s relatively stable economy and employment base, along with obvious supply restraints, will always be a solid base for the housing market. However, given that affordability has generally deteriorated more than elsewhere in the country, you’d have to think that over the next few years Wellington’s property value growth will tend to underperform the national average. SEE THE FULL REPORT HERE: Wellington boom 6 July 2021 |


